ABSTRACT
Welcome to a new report from Nodecharts!
This week, we had a key event on the horizon, and the FOMC has finally decided to lower interest rates by half a point, bringing them to 5%. Although many anticipated this half-point reduction, the decision has triggered an initially positive reaction, suggesting that part of this measure had already been priced in. Even so, it remains to be seen how markets will evolve in the coming days as investors analyze the implications of this cut.
On one hand, a decrease in interest rates is often seen as a stimulus for the economy, as it can increase liquidity and drive investors to seek higher returns in risk assets like Bitcoin. However, a significant reduction can also be interpreted as a signal of concern about potential recession risks on the horizon, which could generate uncertainty and caution in the market. This balance between optimism and caution could be key to market behavior in the coming days.
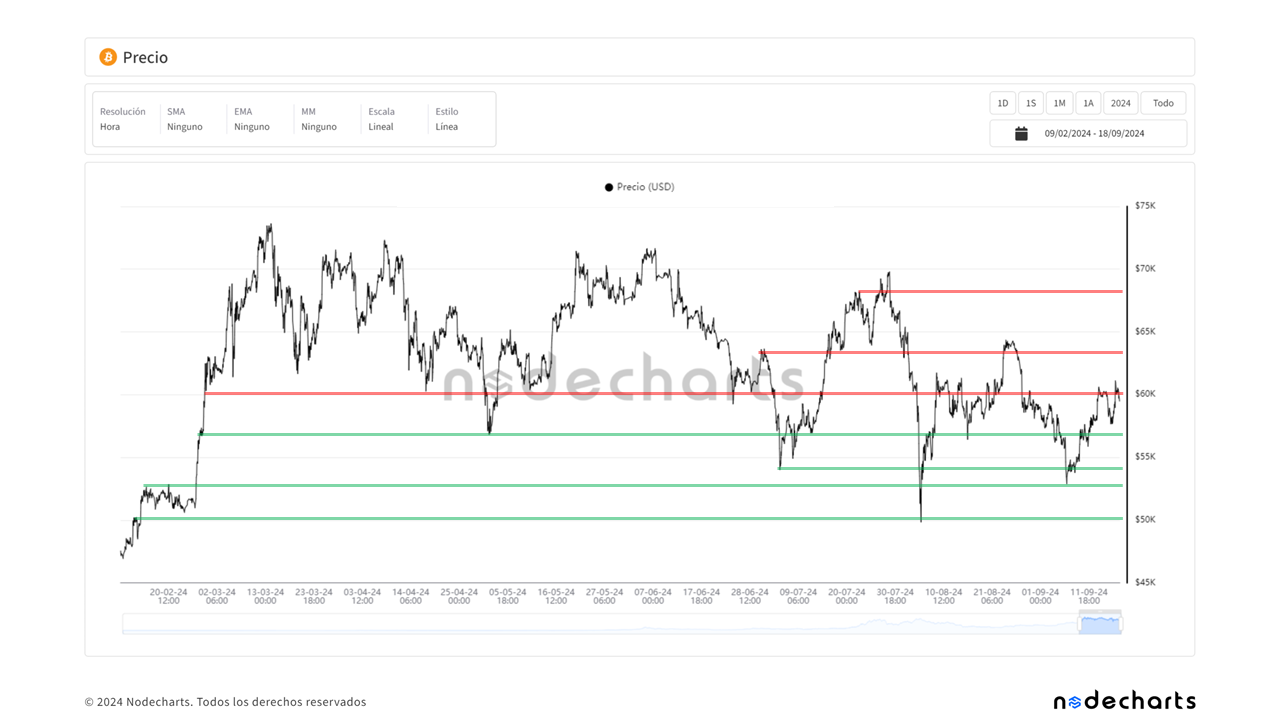
As we approach the end of the week, an increase in volatility can be expected. Therefore, it is important to keep an eye on key support and resistance levels to identify potential opportunities and risks in the short term.
Next, we will analyze the historical behavior of unspent supply held by long-term holders (LTH) across different Bitcoin cycles. This analysis will allow us to identify key patterns of accumulation and distribution and evaluate how they might influence the current cycle.
Historical Analysis of Long-Term Unspent Supply (LTH) in Bitcoin Cycles
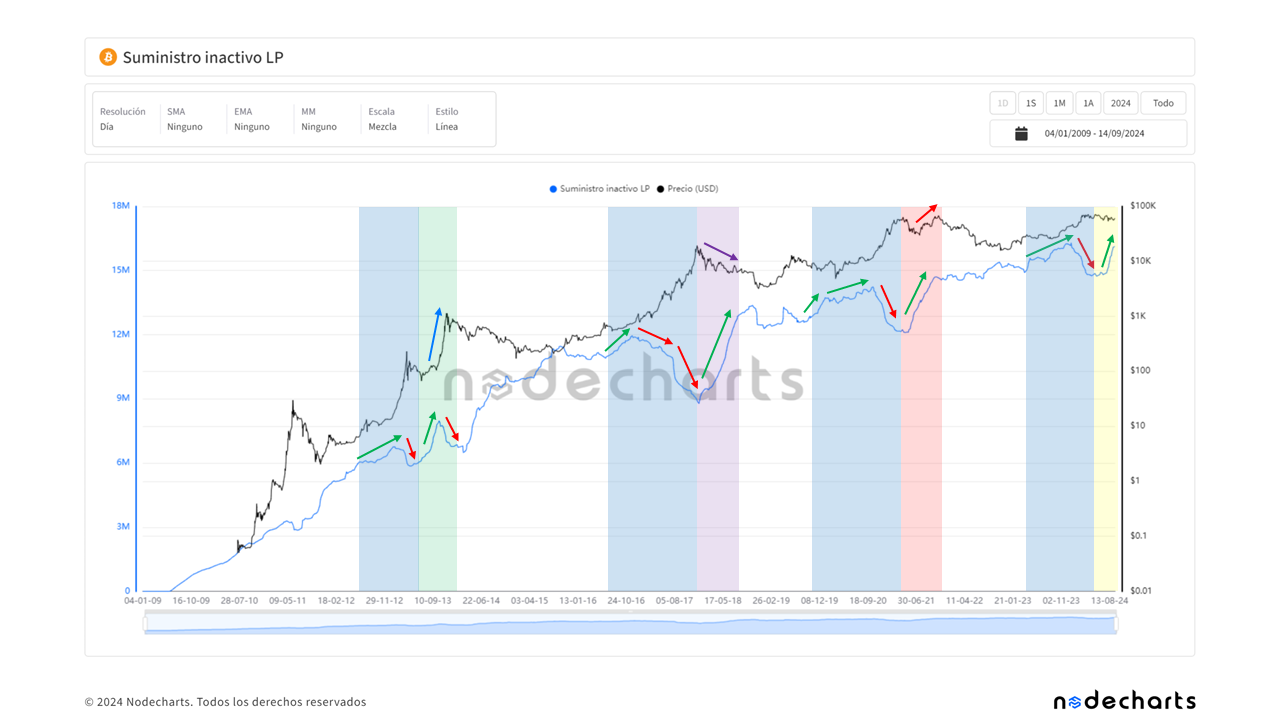
2012-2013 Cycle: Distribution and Reaccumulation Phase at All-Time Highs
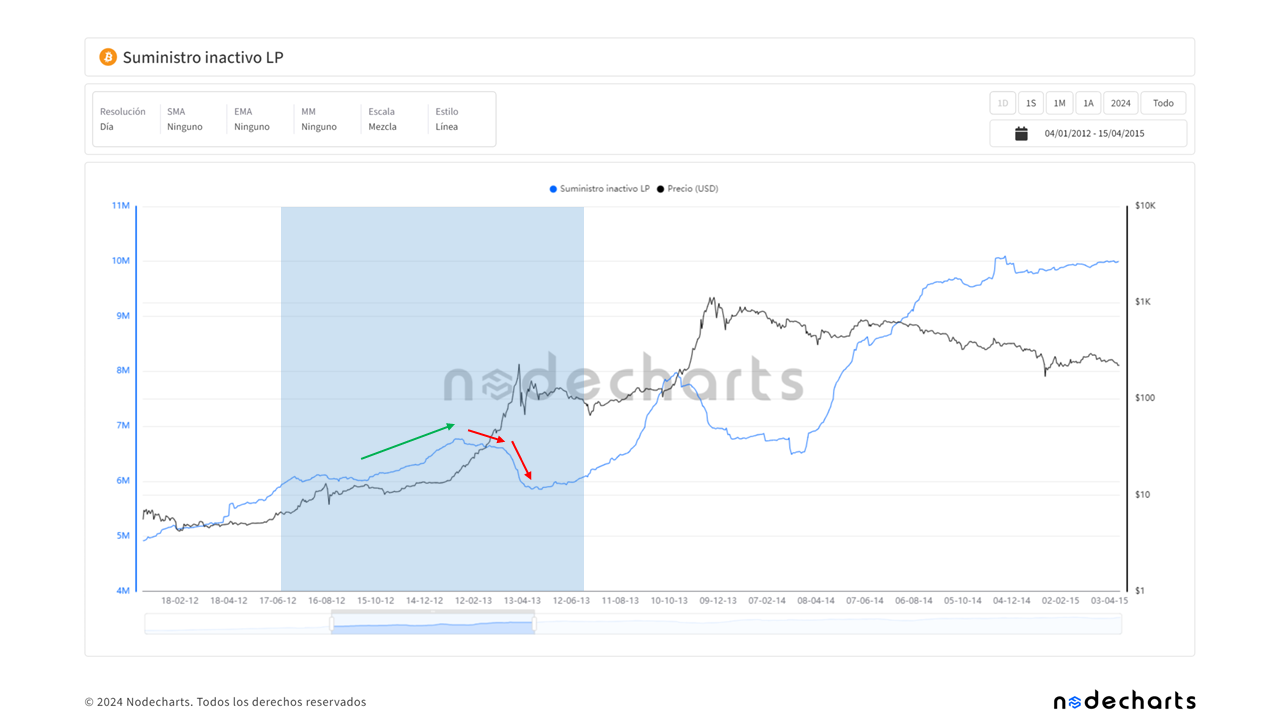
Initial Distribution Phase (Late 2012 – Early 2013):
During this phase, we observed that long-term holders began distributing Bitcoin as the price increased (blue zone). This behavior is characteristic of holders aiming to realize profits during a market uptrend.
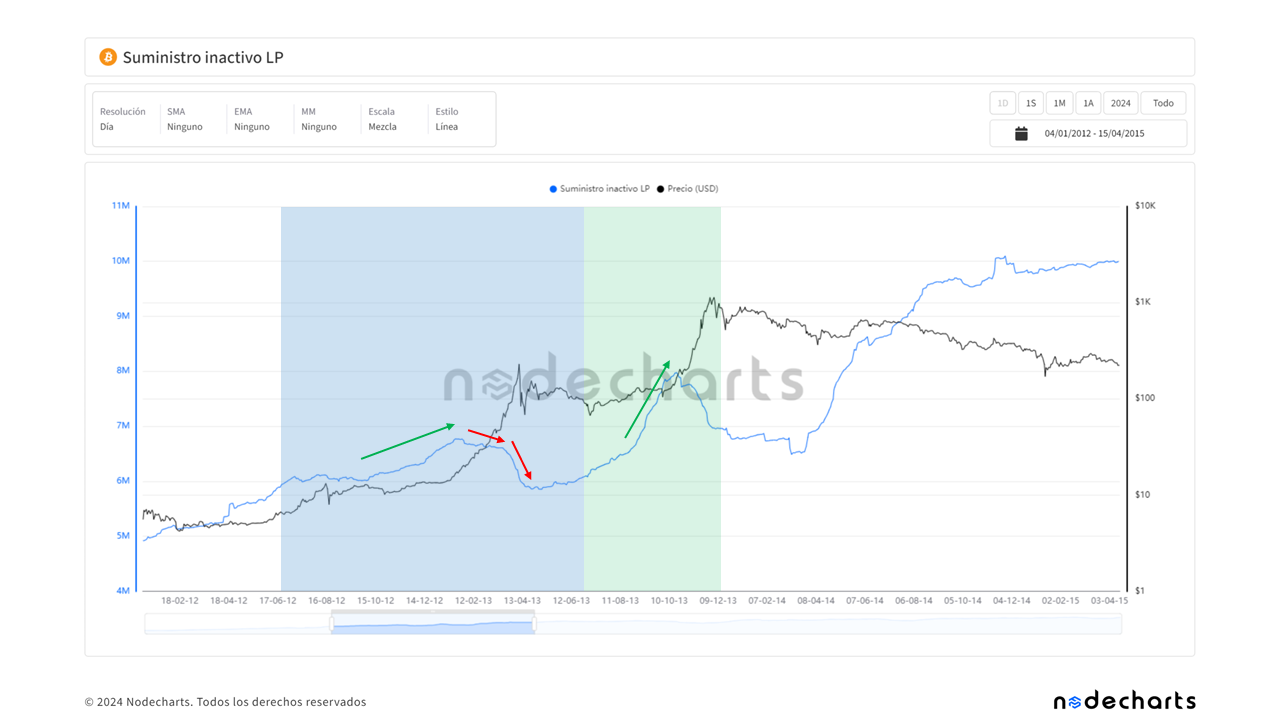
Reaccumulation Phase (Early to Mid-2013):
In the first half of 2013, Bitcoin’s price entered a phase of lateralization. During this period, the long-term unspent supply (LTH) began to increase significantly (green zone), indicating that long-term investors were holding their coins. These inactive BTC could only have been acquired during the lateralization phase or the prior price increase. This suggests that LTH users took advantage of the market consolidation to reaccumulate, anticipating an upcoming bullish move.
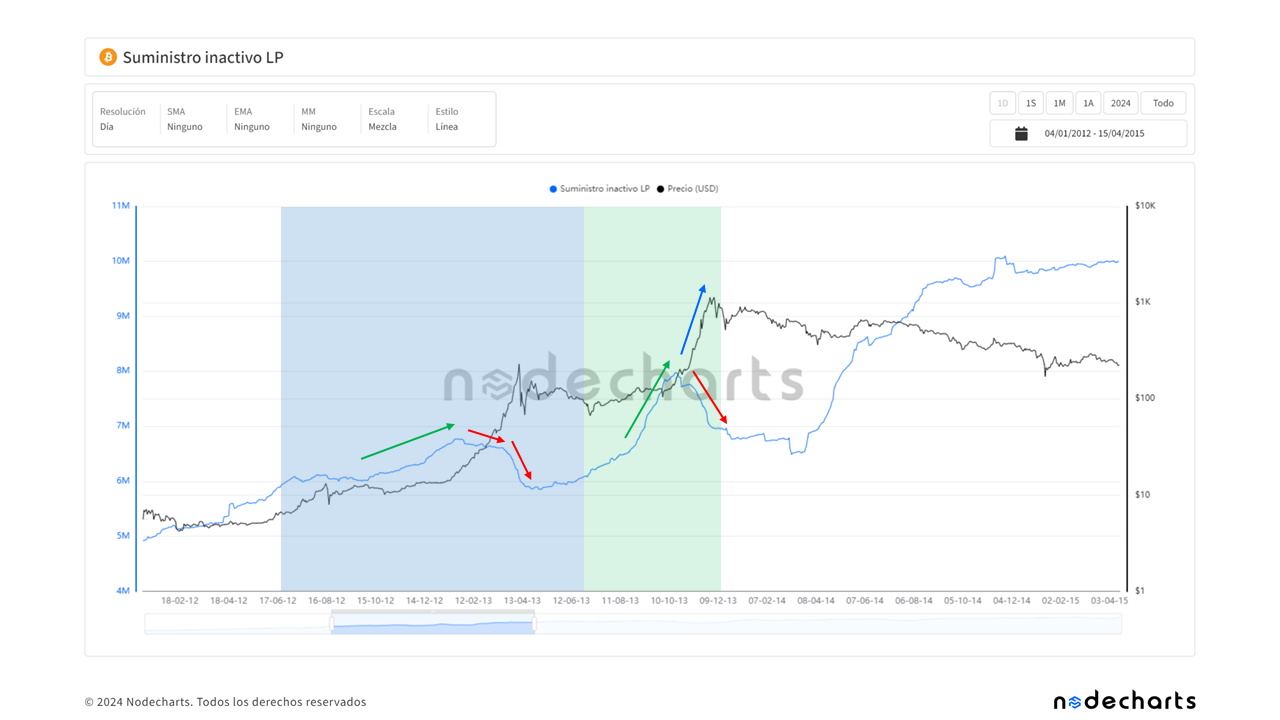
Second Distribution Phase (Late 2013):
In late 2013, as the price reached a new all-time high, a second significant distribution phase by LTH users occurred, indicating that long-term investors were capitalizing on the market peak. This is where clear liquidation is evident, as the LTH supply decreases while the price hits its highs.
2016-2017 Cycle: Distribution During the Bull Run and Accumulation in a Bear Market
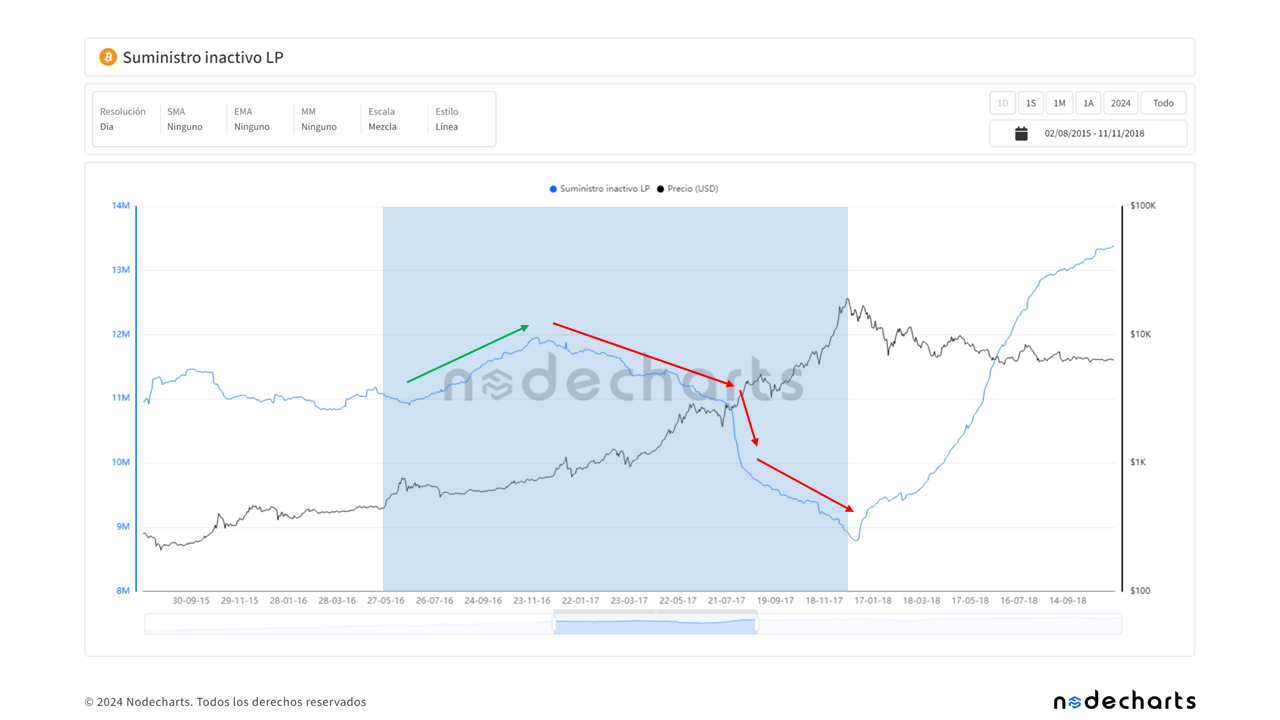
Distribution Phase (2017):
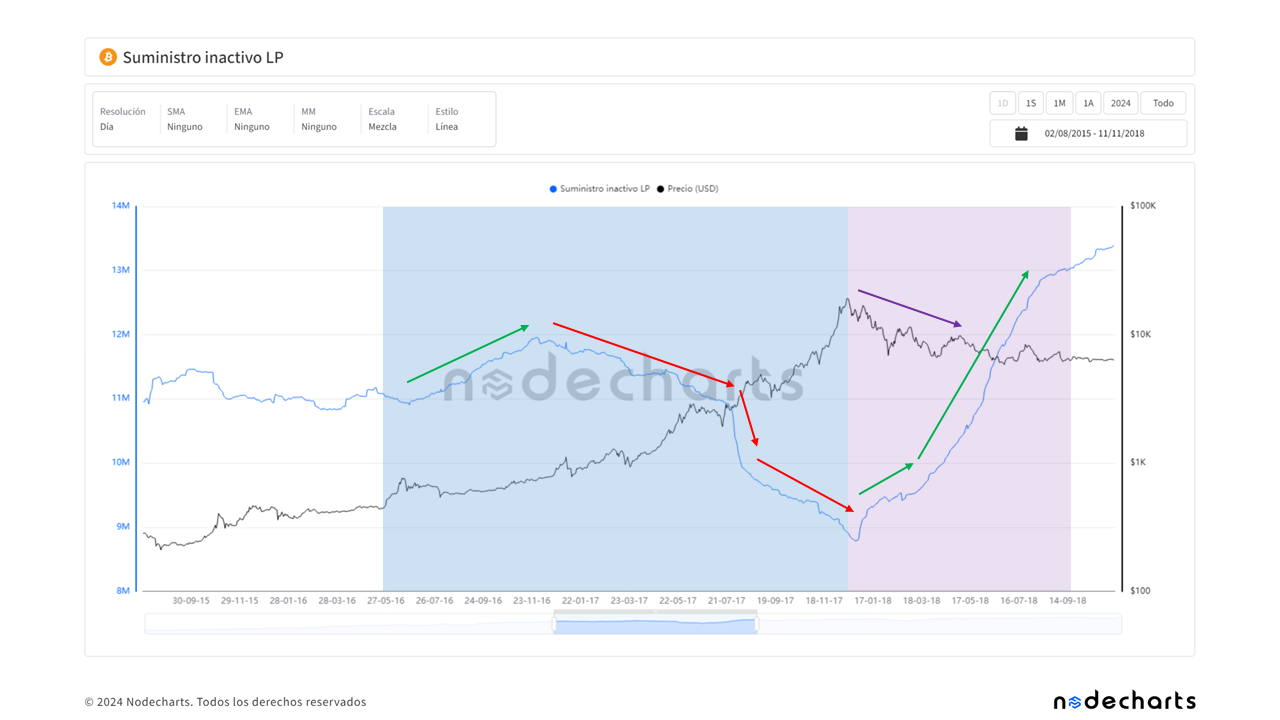
In the 2016-2017 cycle, we observed significant distribution by LTH users as the price began to rise sharply (blue zone). Long-term investors were selling their BTC during the price increase, securing profits as the bull market gained momentum.
Increase in LTH Unspent Supply During Bear Market:
In early 2018, when Bitcoin’s price dropped sharply after its all-time high, we observed a significant increase in the long-term unspent supply (purple zone). This increase was not primarily due to strategic accumulation by experienced investors but rather because many inexperienced users were caught in high positions. Purchases made above $10,000–$20,000 were premature, and instead of selling during the decline, these investors held onto their BTC, becoming trapped in a prolonged bear market.
2020-2021 Cycle: Initial Distribution and Accumulation Without a Second Sale at All-Time Highs
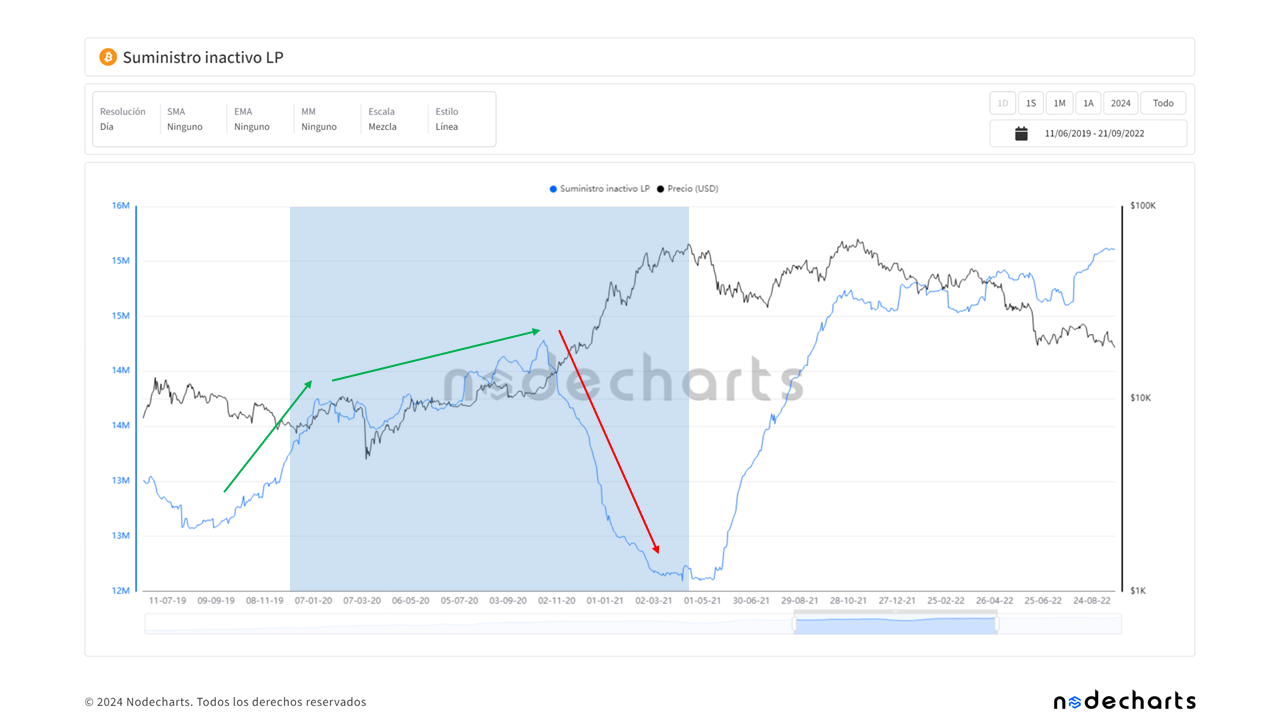
Distribution Phase (2020-2021):
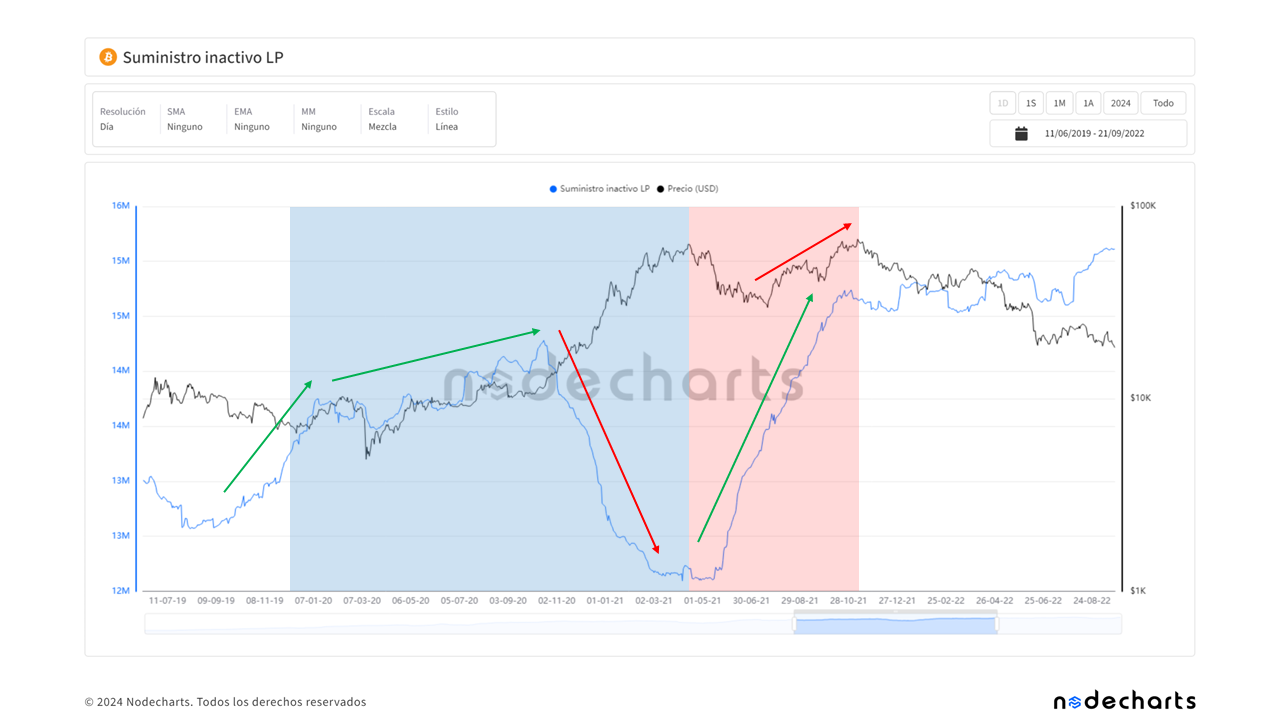
During the bullish phase of 2020, the LTH unspent supply began to decrease (blue zone) as the price rose, following the pattern of previous cycles where LTHs sold part of their holdings during the price increase.
Increase in Supply During the Second Rally:
Unlike the 2013 cycle, LTH supply began to increase (red zone) after the price reached all-time highs in early and mid-2021, indicating that many users who bought during those peaks chose to hold their BTC. There was no significant second phase of distribution when the price reached new highs in late 2021. This suggests that instead of distributing, many long-term holders opted to maintain their positions, possibly trusting in a long-term recovery.
Current Cycle (2023-2024): Accumulation and Consolidation Phase
Initial Distribution (2024):
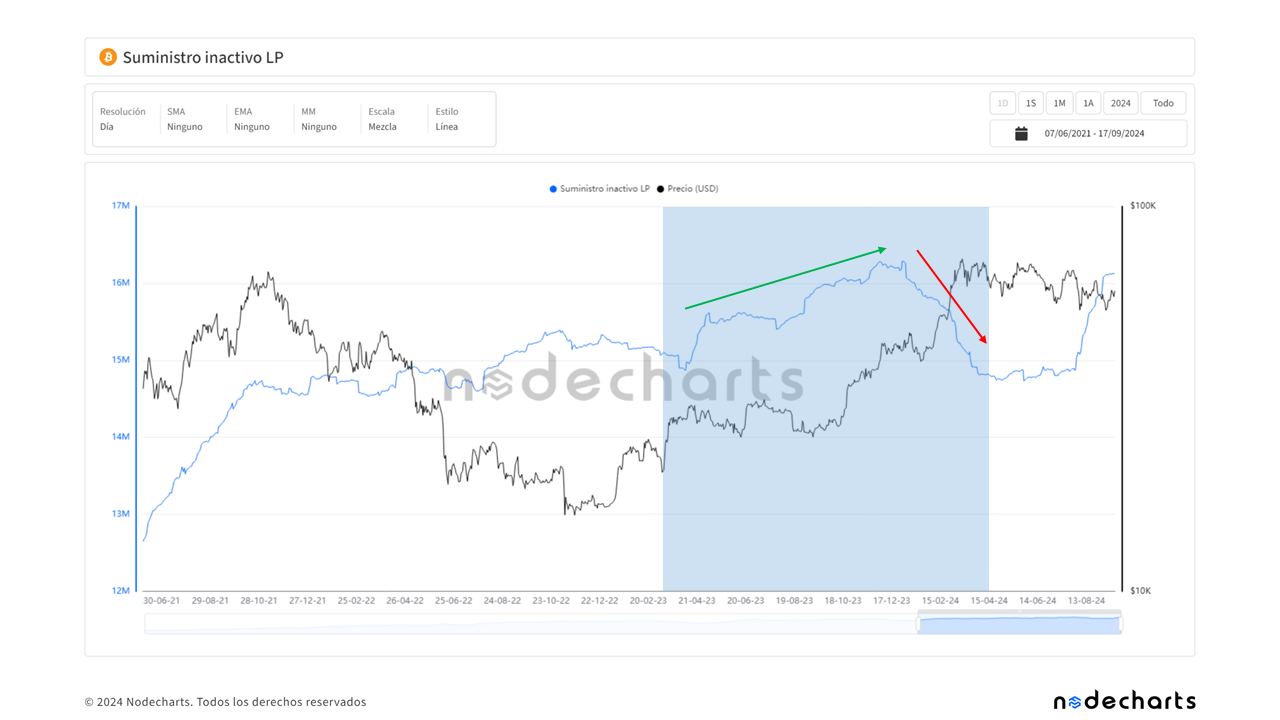
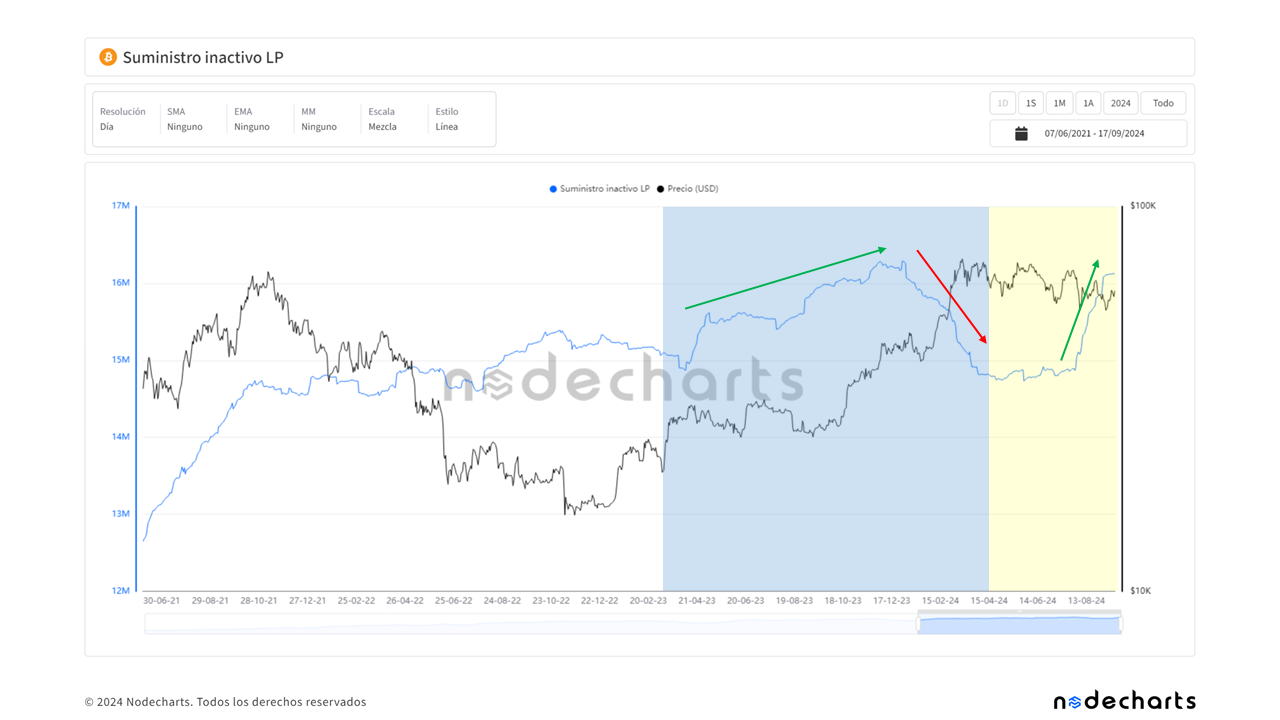
As in previous cycles, we have observed a distribution by LTHs during the price increase phase up to $74,000 (blue zone). However, the most significant point is that after this distribution phase, the unspent supply has started to increase again.
Recent Supply Increase (Last Few Months):
In recent weeks, with the price moving sideways, we have observed an increase in the unspent LTH supply (yellow zone). This behavior suggests that the market is in a consolidation phase, with LTH users accumulating once again. This could indicate that a new rally is being prepared, although it is essential to closely monitor how the price evolves in relation to this metric in the coming weeks.
Projection of Possible Scenarios for the Current Cycle
Based on the comparison with previous cycles, we can outline two bullish scenarios and one bearish scenario, based on the behavior of the dormant LP supply and historical market patterns.
CONCLUSION
The historical analysis of the behavior of unspent supply held by long-term users reveals important patterns that have preceded both significant price increases and corrections in Bitcoin. In previous cycles, we have observed how long-term users have played a key role, either accumulating during market bottoms and consolidation phases or distributing during bullish phases.
In the current cycle, we have observed similar behavior with an initial distribution of Bitcoin by these users as the price increased, followed by a recent reaccumulation phase. This pattern may suggest that long-term users are repositioning themselves for the market’s upcoming movements.
Although projections for possible future scenarios may vary, the history of past cycles and the on-chain behavior of the unspent supply LTH provide insight into Bitcoin’s potential price evolution. However, it is important to remain attentive to various indicators in the coming months to confirm the market’s direction in this new phase.
If you would like to learn more about Bitcoin’s upcoming movements and how we are analyzing them, don’t miss our advanced course. Every two weeks, we host live sessions with students to study the market and analyze the strategies presented in our course, using all available data. Now, by purchasing the advanced course, you’ll also receive the basic course as a bonus. Don’t hesitate to join now and stay ahead of Bitcoin’s upcoming price movements. Additionally, you can join our Discord, where you’ll be able to interact with our team.
Disclaimer of Liability This article does not offer any investment advice. All data is provided for informational purposes only. No investment decision shall be based on the information provided herein and you are solely responsible for your own investment decisions.
