ABSTRACT
Welcome to a new report from Nodecharts!
The recent military conflict between Israel and Iran has sparked a new wave of uncertainty in global markets, significantly impacting the cryptocurrency ecosystem. Geopolitical tensions have caused Bitcoin’s price to retreat once again to the $60,000 zone, a level that is not only significant from a technical perspective but also represents a psychological threshold for many investors.
If the conflict persists, financial market volatility is likely to increase further. Risk aversion may drive investors to withdraw capital from more volatile assets like Bitcoin and other cryptocurrencies, seeking refuge in what are considered safer investments.
Additionally, the U.S. presidential elections are just around the corner. Historically, election years tend to favor positive market performance, at least until the elections conclude. This pattern is attributed to the political and economic uncertainty surrounding elections, which often prompts governments to implement policies that stimulate the economy and maintain investor confidence.
It is possible that this effect could extend to the cryptocurrency market, influencing Bitcoin’s behavior in the coming months.
Now, as usual, let’s review the support and resistance levels that Bitcoin faces in the short term.
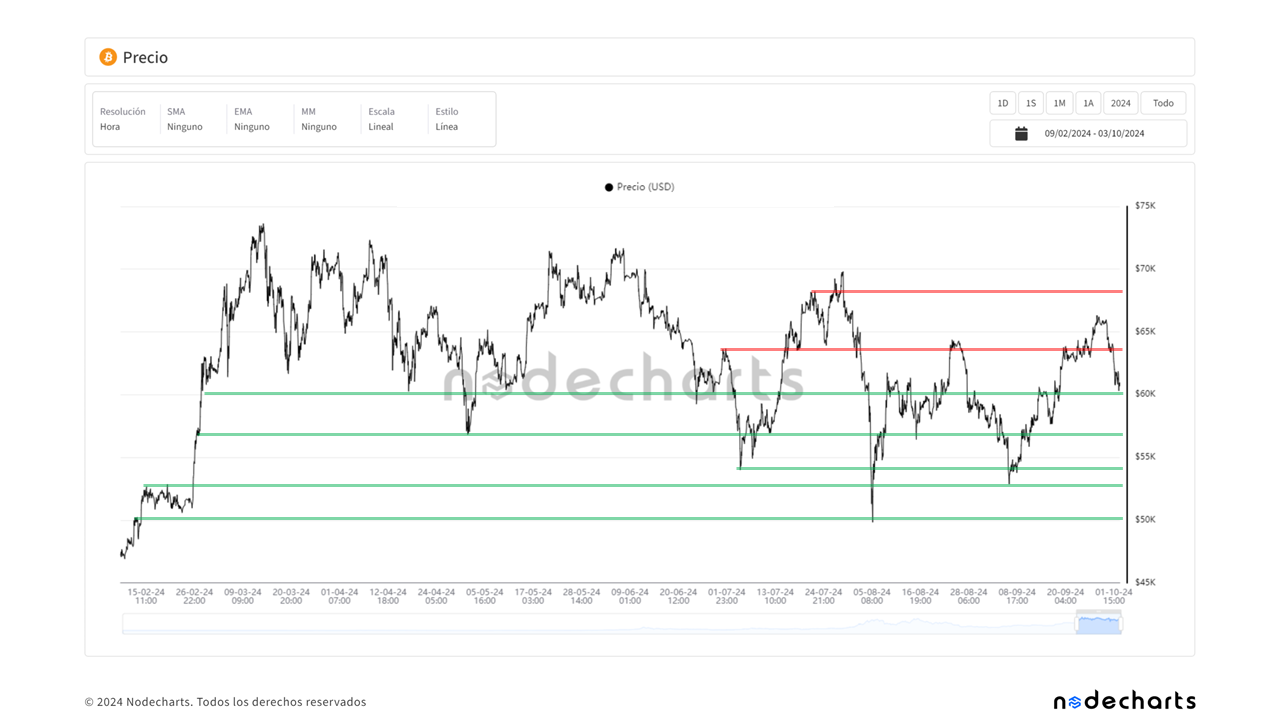
In today’s report, we will analyze several realized prices and how they can be used to understand market direction and identify potential support zones. It is important to note that all the charts examined are hourly charts, which allow movements to be detected earlier than daily charts. Daily charts require waiting for the day’s close to gain new information, and by then, the initial part of the movement has often already occurred, limiting the opportunities for action. These hourly charts are available with our Expert license.
Before delving into the analysis of each chart, it is important to address a common misconception among users without on-chain analysis knowledge. Many mistakenly believe that realized prices are similar to moving averages, but this is not correct.
Realized prices reflect the price at which bitcoins were acquired, specifically considering the moment when transactions occurred. For example, when analyzing the realized price for a period between 1 week and 1 month, if more purchases were made during days 27-30 of the period, the realized price will show a smaller increase at the current moment, as those purchases are closer to the end of the time range. Conversely, if more purchases occurred during days 7-10, the metric will increase more at the current moment, as those transactions carry greater weight in the calculation due to their earlier position in the timeframe. This provides a deeper insight into the real behavior of investors across different timeframes.
In contrast, moving averages simply calculate an average of recent prices defined in the metric, without considering the timing of acquisition or how purchases at different times impact the current value. They do not account for the temporal distribution of purchases or the price at which bitcoins were acquired in different periods. Therefore, realized prices provide a more accurate and useful perspective for understanding market direction and identifying potential support zones.
Realized Price STH
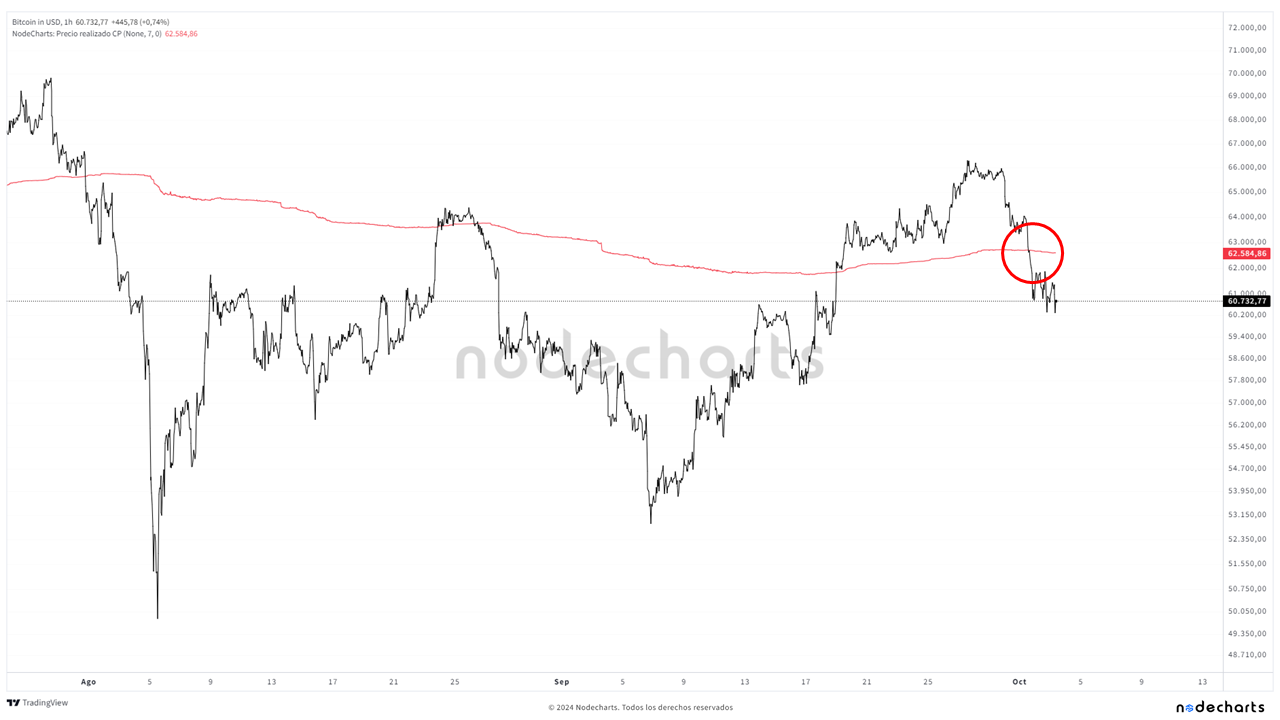
The first metric we will review is the short-term realized price. We have covered it in previous reports, but for those reading their first report, this metric represents the average purchase price of users who acquired their bitcoins in the last 155 days. This indicator serves as a reference to observe the general behavior of speculators within the network.
Recently, the short-term realized price was surpassed to the upside. However, as we warned in our private Discord channels for our paying clients, if it didn’t hold above this level, it would signal weakness. This is exactly what has happened: the price has broken back below this level, currently showing little strength in the movement. It’s essential for the price to recover and stay above this level to consider short-term bullish movements.
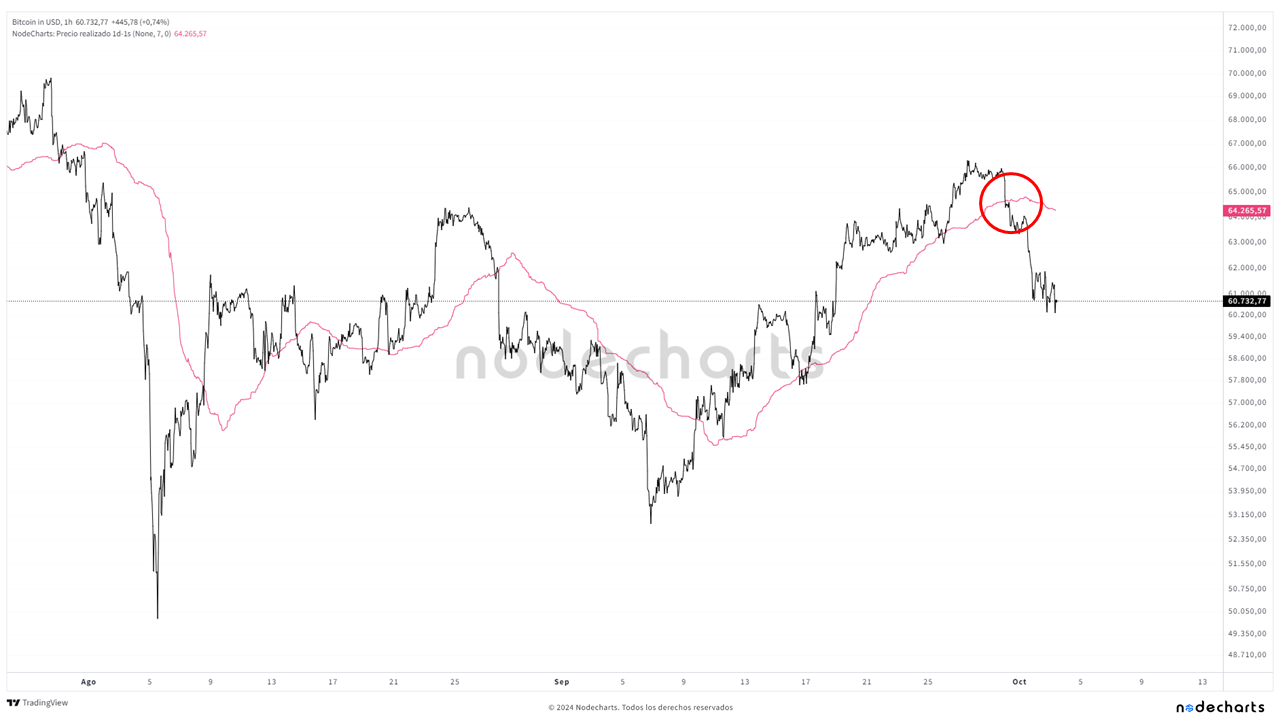
Realized Price 1 Day to 1 Week
The next realized price metric is the one covering 1 day to 1 week, which is much more responsive to Bitcoin’s price movements as it only considers acquisition prices within that short period. During trending movements, this indicator serves as the first warning of a trend reversal or, at the very least, a lateral movement. It signaled a reversal on September 30, indicating a potential trend change.
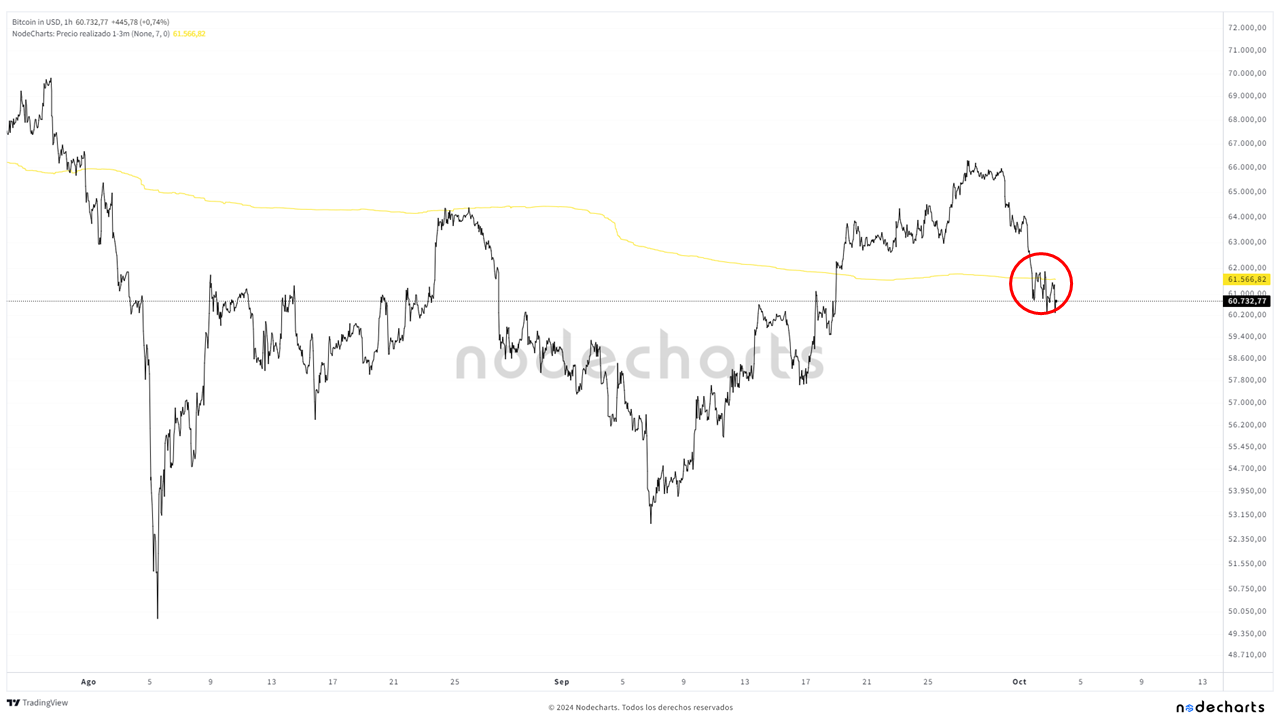
Realized Price 1 to 3 Months
The realized price for the 1 to 3 month range is showing a zone where the price is fluctuating. It has been breached and is currently being tested, rejecting an upward breakout for now. This reinforces the signal of weakness if it cannot be reversed. It will be important to break above this level to consider a continuation of the bullish trend.
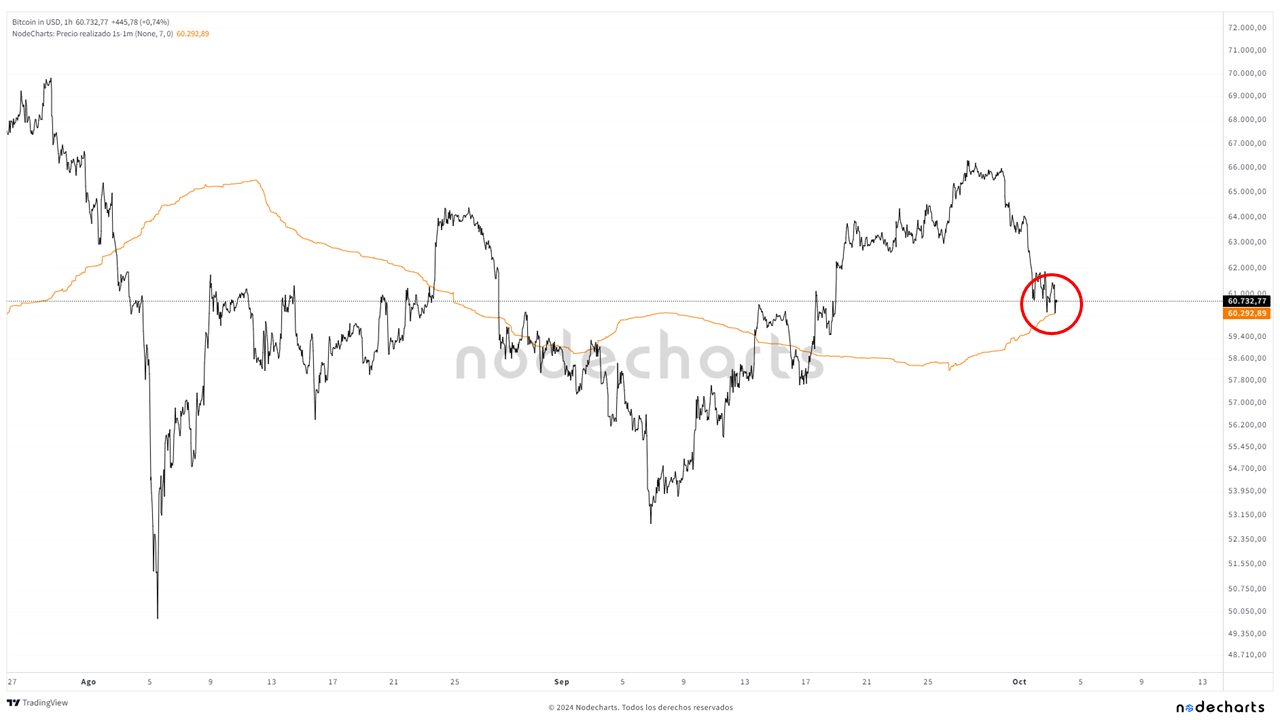
Realized Price 1 Week to 1 Month
The realized price for the 1 week to 1 month range indicates a potential support level. Today, this level was tested, and the price momentarily bounced off it. If the price fails to reverse the bearish movement in the short term, this level could act as a strong support. However, if it fails to hold, it would also signal weakness. This realized price is around $60,000, a level that, as we’ve mentioned, represents a psychological threshold for investors.
Realized Price of Addresses Holding Over 100,000 Bitcoins
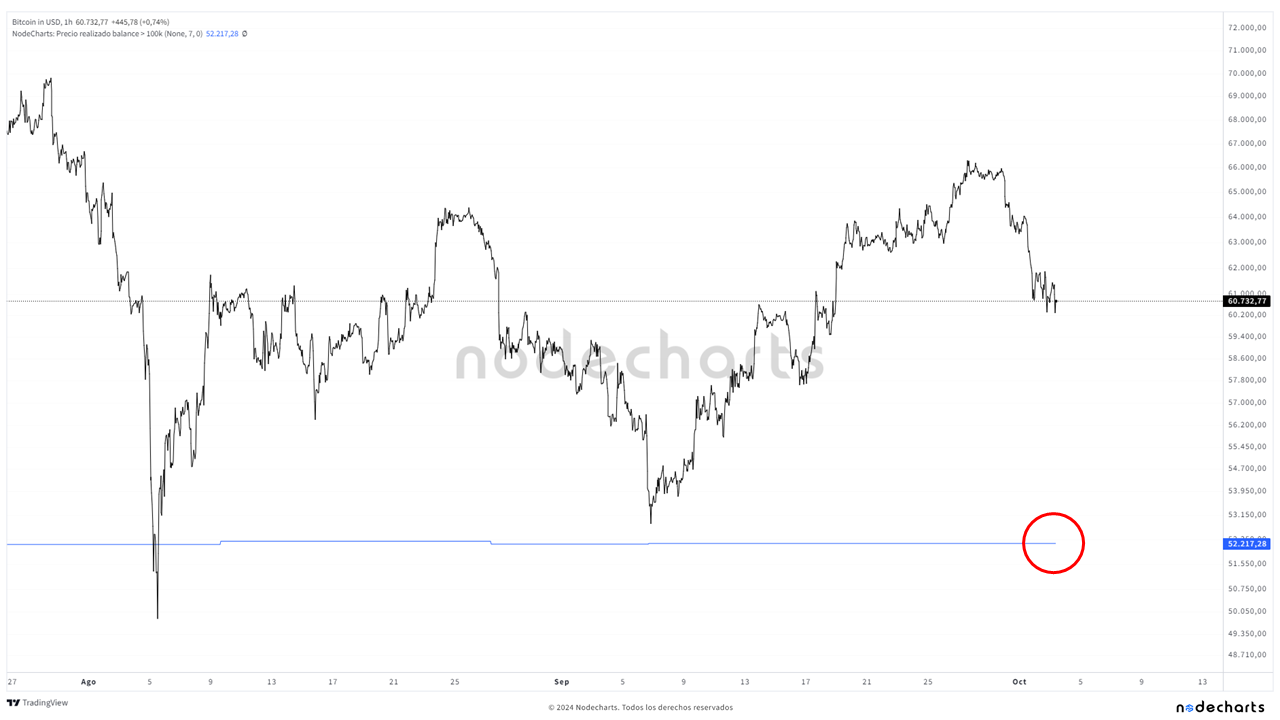
If the realized price for the 1-week to 1-month range does not act as support, we have an interesting level to monitor at the realized price of addresses holding over 100,000 bitcoins, as this level has previously acted as support. Although it is around $52,000, the weakness of the momentum shown so far and a potential break of the $60,000 level could lead us to revisit these prices.
Simple Strategy Using Realized Prices from 1–24 Hours and 1 Day–1 Week
Now we will apply a simple strategy using the realized price from 1–24 hours and the realized price from 1 day to 1 week. In this strategy, a purchase is made when the 1–24 hour realized price crosses above the 1-day to 1-week realized price, and a sale is executed when the 1–24 hour realized price crosses below the 1-day to 1-week realized price.
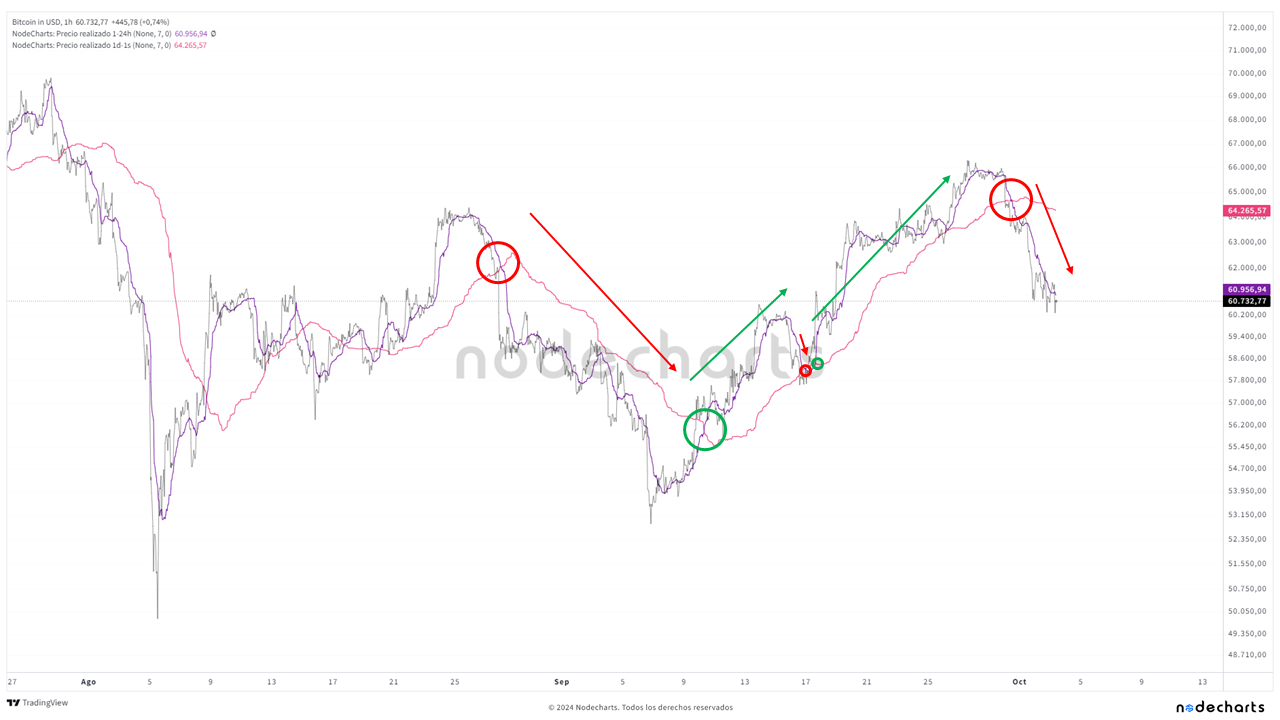
Although the same strategy could be applied simply using the market price and the 1-day to 1-week realized price, the 1–24 hour realized price offers advantages. First, it filters out transactions under one hour, which typically add noise to the metrics. Second, it smooths the average to detect more trend-driven movements and reduce the number of false crossovers.
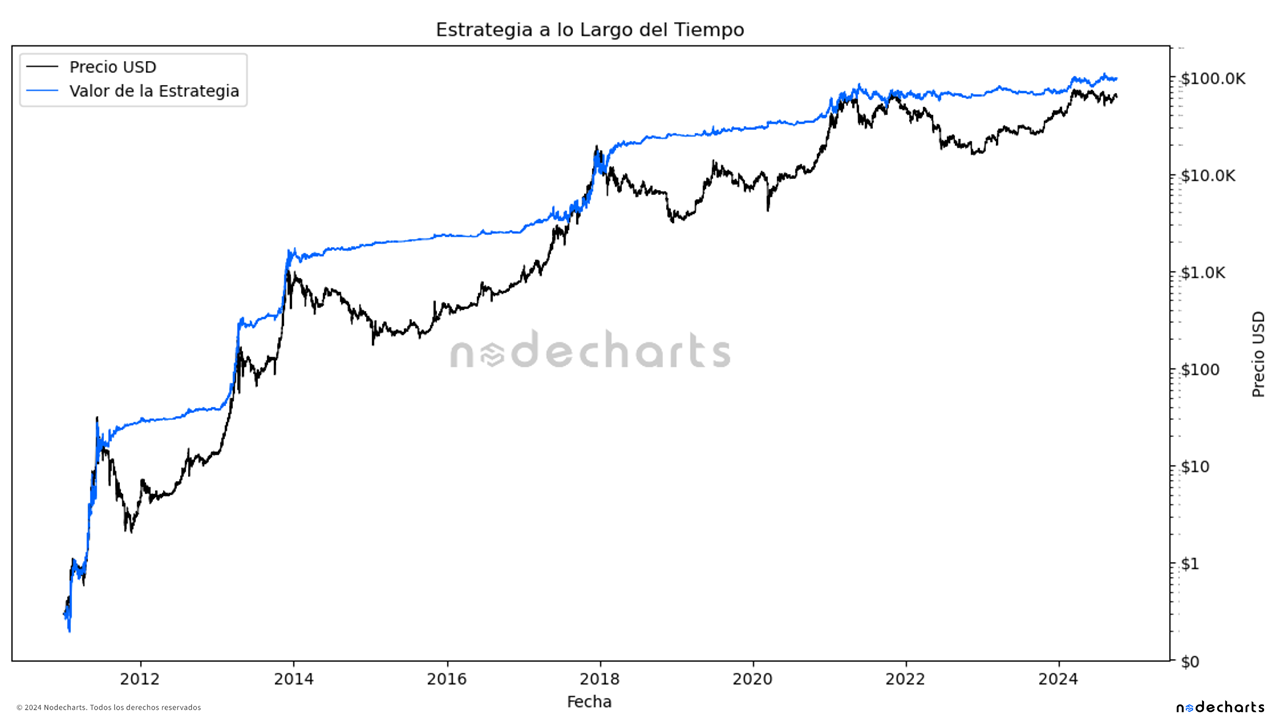
This strategy has been tested on an hourly timeframe, currently offering an accumulated return since 2011 that is 1.6x greater than a buy-and-hold strategy. However, there is room for improvement, as the strategy shows underperformance in certain periods. By applying stop-losses and incorporating additional factors, such as adding other metrics to the strategy, the returns could improve significantly.
Remember that past performance never guarantees future results. Our goal here is to demonstrate that, with the right knowledge, it is possible to identify opportunities and make decisions that outperform passive strategies like Buy & Hold. Therefore, we invite you to join the next session of our advanced training, starting on October 14, to learn this and many other strategies. Additionally, we are offering a special 30% discount for everyone who enrolls in this session using the code “BULLRUN30.”
CONCLUSION
In summary, the on-chain metrics analyzed indicate that the Bitcoin market is at a critical point. The inability to maintain key realized price levels suggests weakness in the short term. However, there are important support zones, such as the 1-week to 1-month realized price around $60,000, which could provide stability and potentially reverse the bearish trend.
If the conflict between Israel and Iran prolongs, it is likely that volatility will continue to impact the crypto market. It will be important to monitor how these geopolitical events influence overall market sentiment, particularly for Bitcoin and other cryptocurrencies.
On the other hand, the upcoming U.S. presidential elections could play a significant role in market behavior. Historically, financial markets tend to show resilience and growth during election years, at least until the elections take place. This phenomenon could positively influence the cryptocurrency market, providing an opportunity for Bitcoin’s price to recover.
Finally, it is important to use advanced analysis tools, such as on-chain metrics, to stay on the right side of the market at all times. With the right knowledge, we have already proven that it is possible to identify opportunities and make better decisions to achieve higher returns.
If you would like to learn more about Bitcoin’s upcoming movements and how we are analyzing them, don’t miss our advanced course. Every two weeks, we host live sessions with students to study the market and analyze the strategies presented in our course, using all available data. Now, by purchasing the advanced course, you’ll also receive the basic course as a bonus. Don’t hesitate to join now and stay ahead of Bitcoin’s upcoming price movements. Additionally, you can join our Discord, where you’ll be able to interact with our team.
Disclaimer of Liability This article does not offer any investment advice. All data is provided for informational purposes only. No investment decision shall be based on the information provided herein and you are solely responsible for your own investment decisions.
