ABSTRACT
Welcome to a new report from Nodecharts!
In recent days, we have witnessed a remarkable surge in Bitcoin’s price, reaching levels nearly equal to its all-time high. This bullish movement has generated enthusiasm in the market and reignited the interest of investors and analysts.
An important factor we attribute to the price increase, as highlighted in our latest report, is the upcoming U.S. presidential election. During election years and in the days leading up to the elections, the market typically shows an upward trend.
Additionally, tomorrow we will have the monthly price close, which could mark the first close above $71,000 after seven months of not surpassing the March 2024 price level. If this occurs, it would indicate strength in Bitcoin’s price, with an engulfing candle relative to those months. As always, we will provide our perspective in the report’s conclusion.
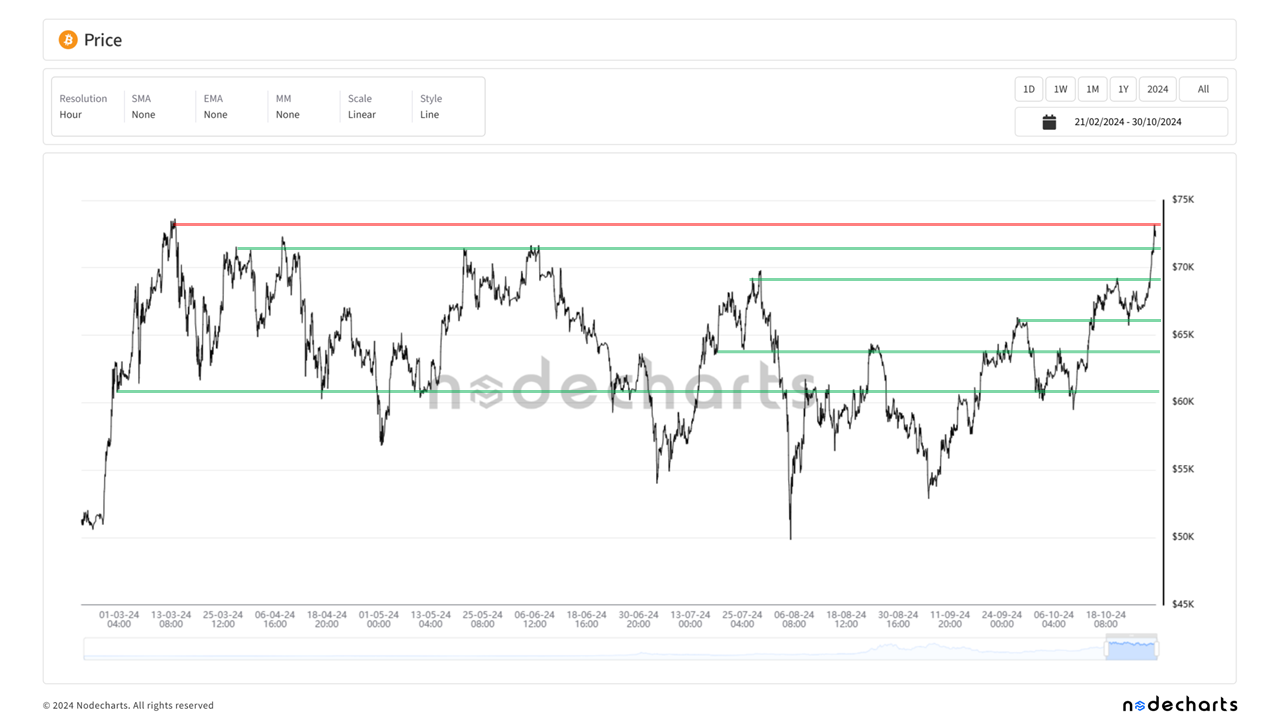
As usual, we will analyze the key support and resistance levels Bitcoin faces in the short term. These levels will help us better understand price behavior and identify potential opportunities.
Signals analysis: Detecting cycle beginnings and endings
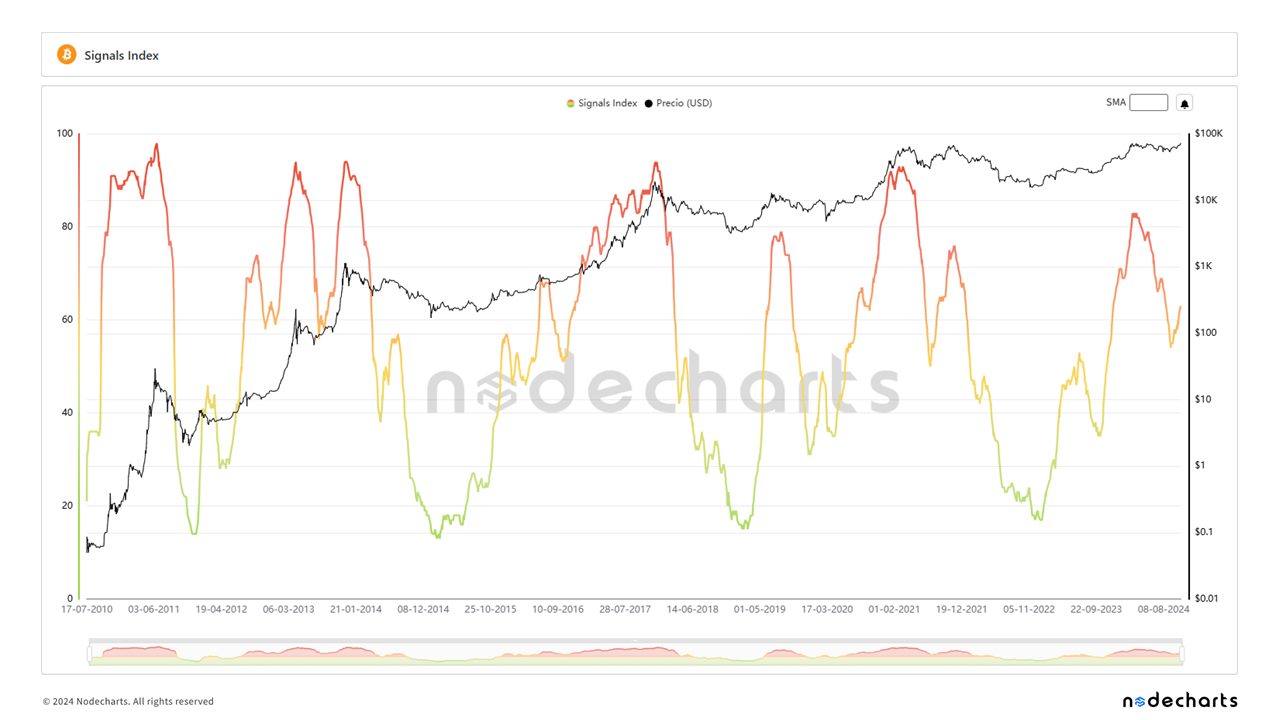
Today, we will focus on analyzing what’s happening in Signals, the Nodecharts tool that helps us determine where we are in the cycle. Not only that, but as we will see in today’s report, it can also assist in making entries during the cycle for those not currently positioned in the market.
Additionally, it’s the ideal tool for implementing DCA (Dollar-Cost Averaging), as knowing where we are in the cycle allows us to apply simple accumulation strategies while Signals remains below levels of 90, and especially to avoid market exposure during bearish cycles.
And how was Signals created?
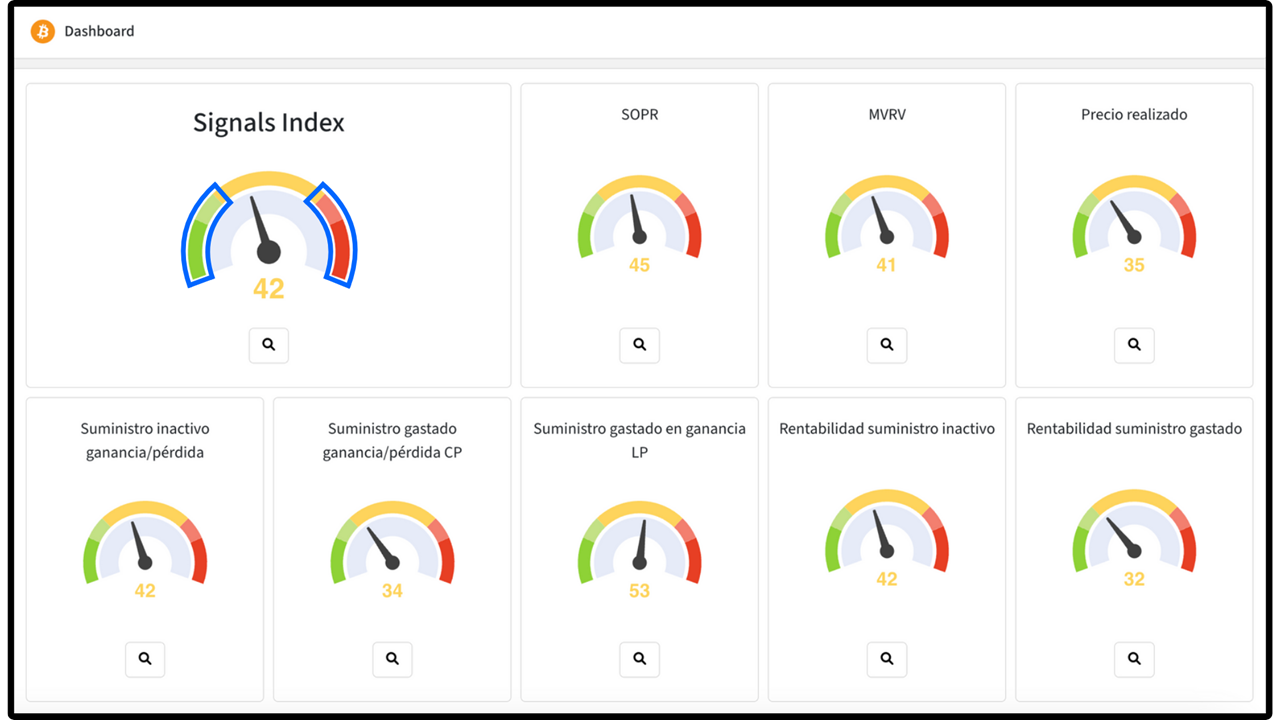
This tool provides a clear view of trends and patterns in the Bitcoin network. By combining eight indicators based on profits, losses, and returns, Signals enables a comprehensive analysis of Bitcoin market cycles, accurately identifying accumulation and distribution zones.
Signals also presents these indicators through visually intuitive gauges that provide an immediate representation of market conditions. These gauges facilitate quick and straightforward data interpretation, allowing investors to make informed decisions more swiftly.
Accumulation and distribution zones marked by Signals
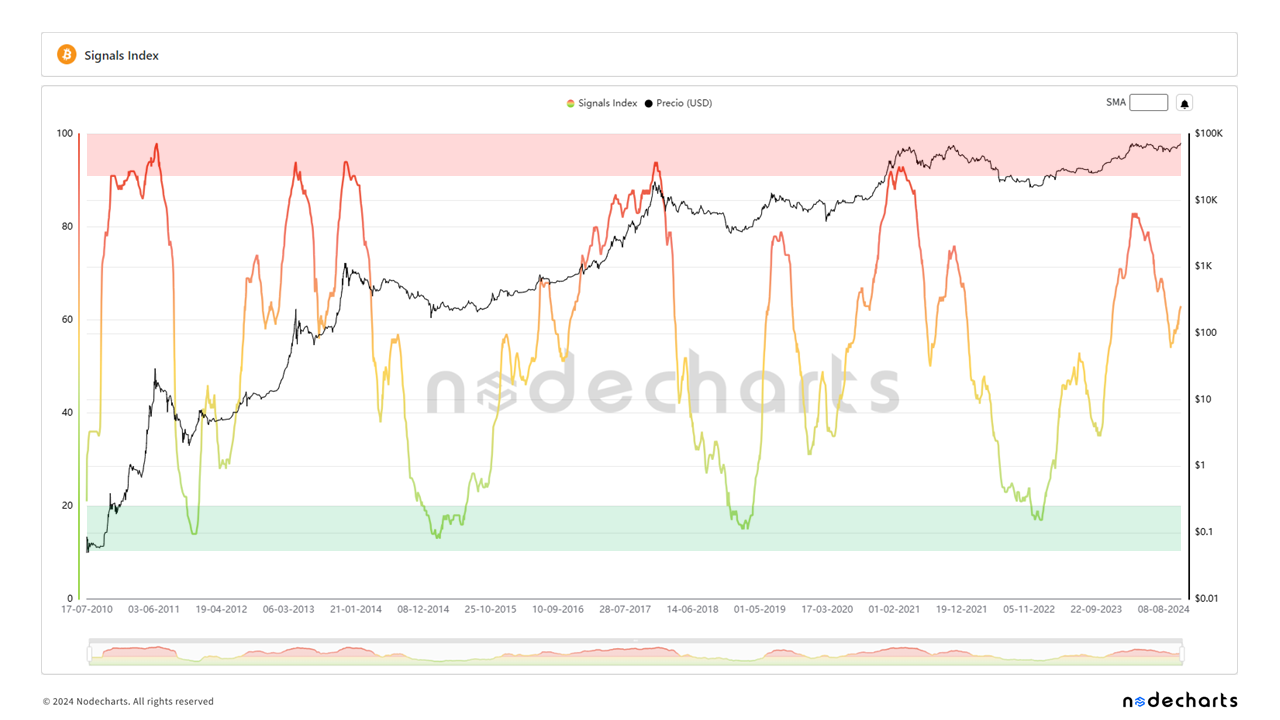
At the time, Signals worked perfectly for us to determine when to enter the market due to an accumulation zone; all levels below 20 are favorable for entering the market.
Currently, we are waiting for it to reach the red zone with values above 90, which will mark the points where Bitcoin will be overbought. These zones are shown in the following image.
Are you willing to miss the selling zone?
With Signals, you have the opportunity to buy and sell at the best points in the cycle, maximizing your returns. Get a basic license on our platform and access this tool.
Remember that with the launch of our new tool, Estudio PRO, you can get a 40% discount on our advanced training or any data plan until November 4 by using the code ESTUDIOPRO40.
Identification of medium-term reversal zones with Signals
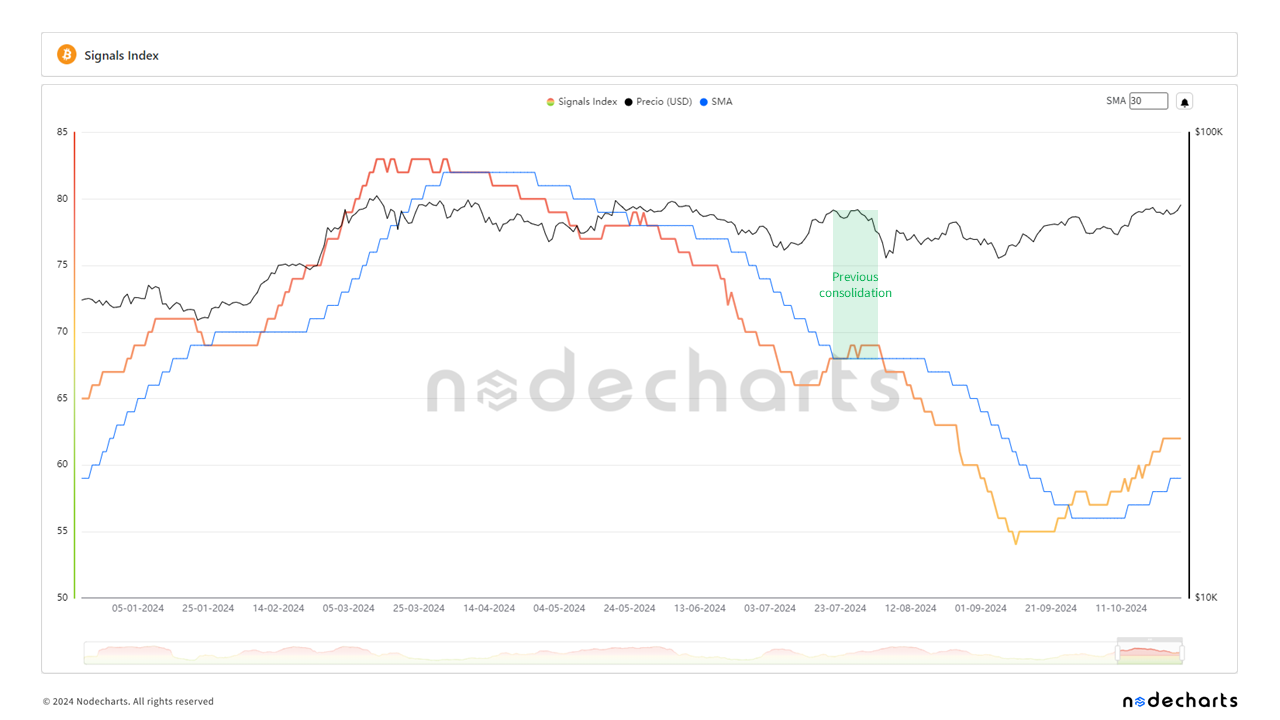
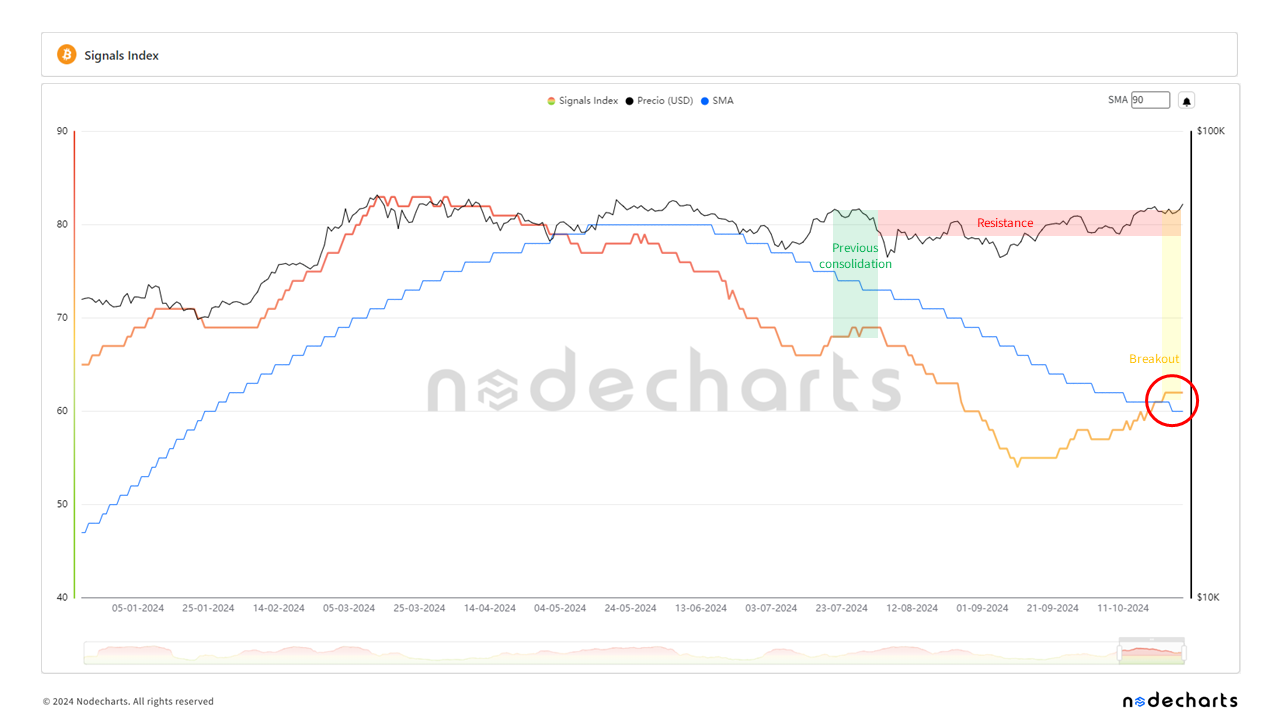
In addition to detecting cycle beginnings and endings, Signals is also useful for identifying medium-term price reversal zones. Currently, it is signaling a trend change. We have historically studied how these breakouts should appear to be considered valid and reliable.
We base this analysis on the 30, 60, and 90-period moving averages of Signals.
Steps to detect a possible reversal
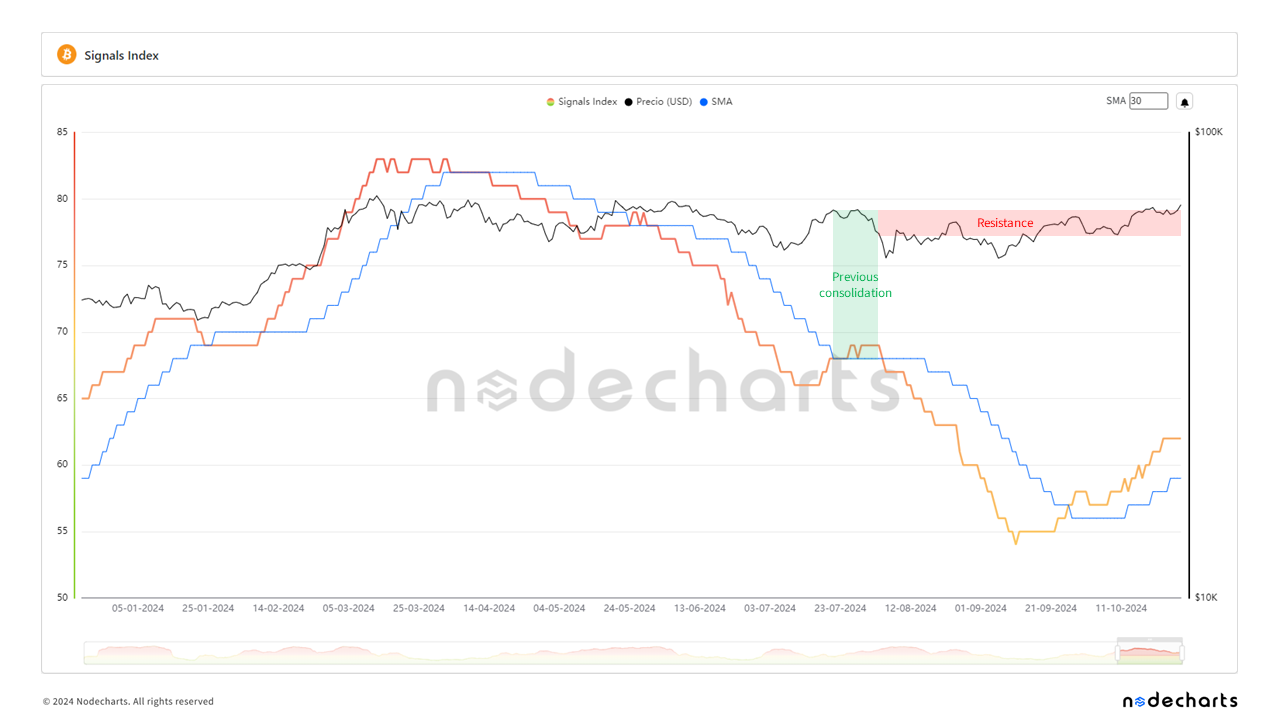
1. Detection of the consolidation zone
The first step is to identify the zone where Signals consolidated for the longest time before the moving average crossed downward. We mark these zones in green.
2. Projection of resistance zones
Once these price areas are identified, we project them into the future to form a resistance zone that the price must overcome. We mark these zones in red. These areas act as barriers that, when surpassed, can indicate a continuation of the bullish trend.
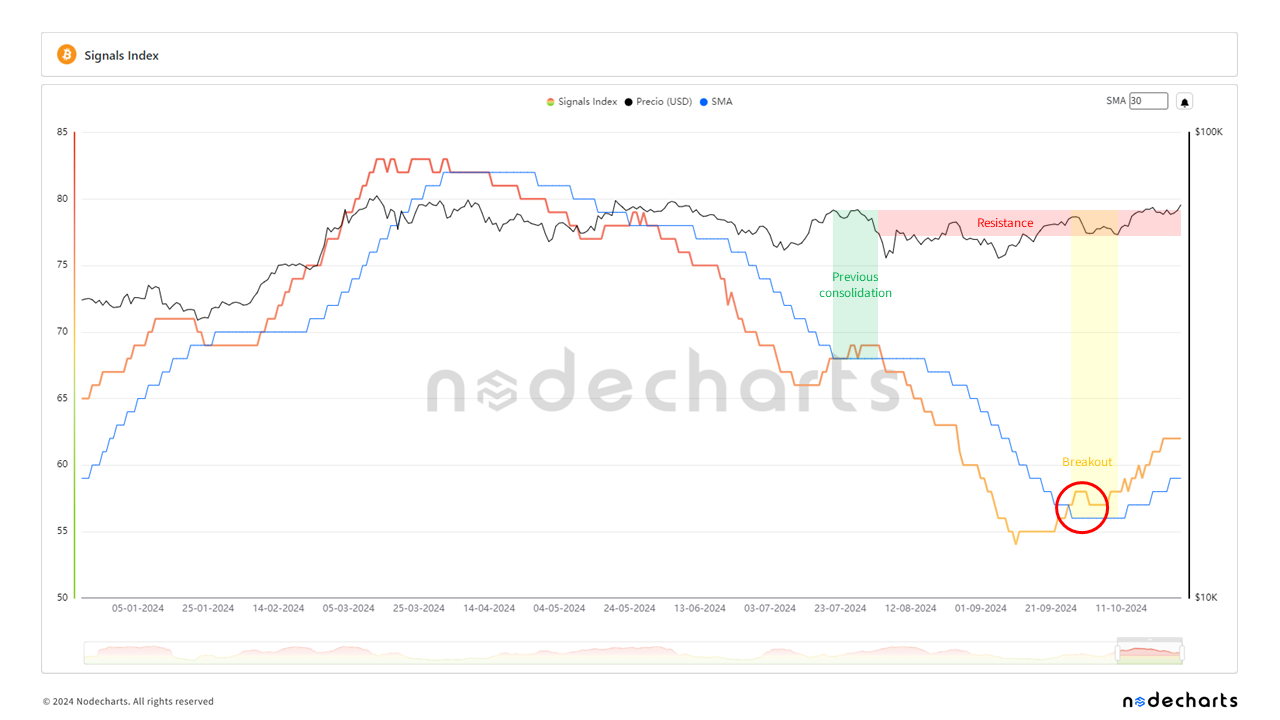
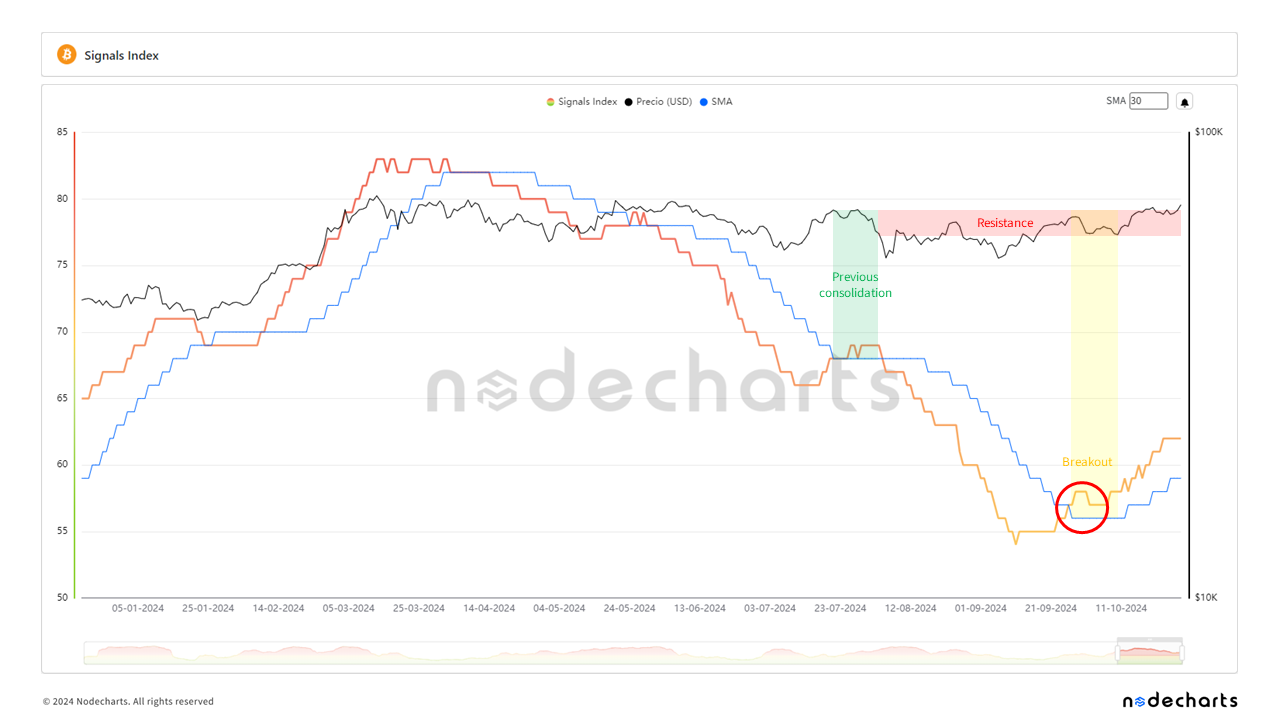
3. Analysis of moving average breakouts
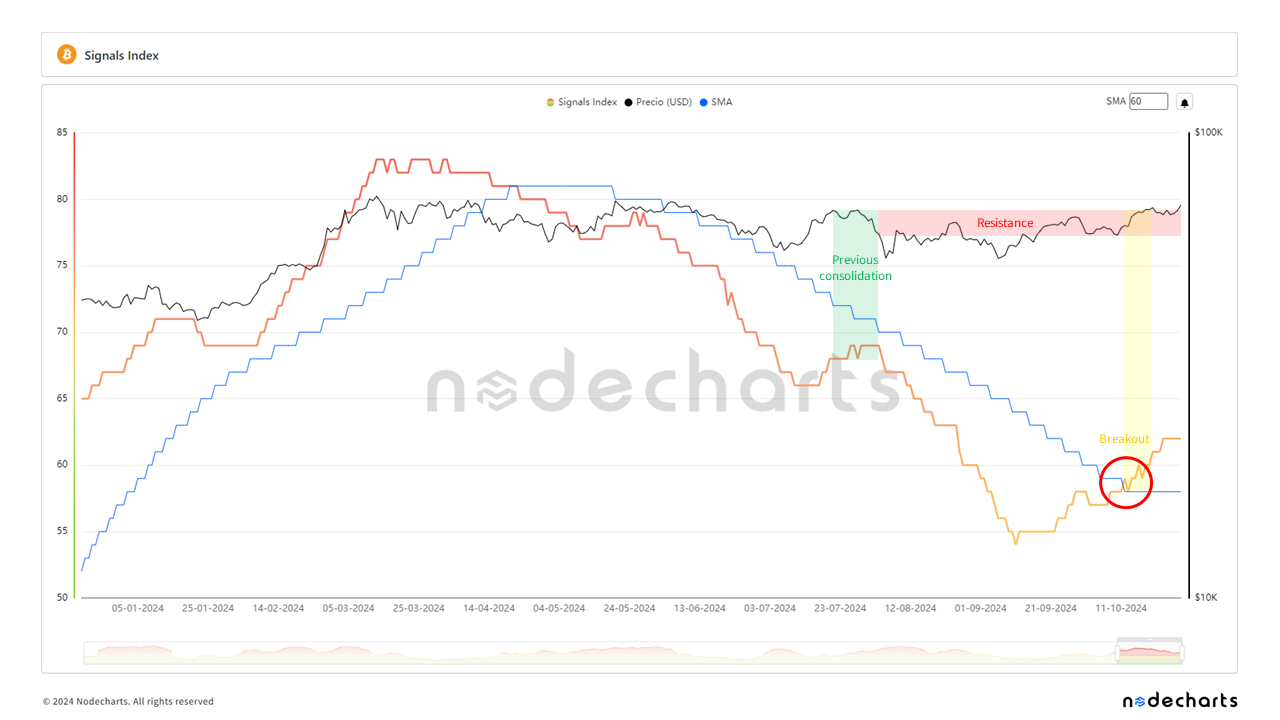
With the resistance zones identified, we look for breakouts in the moving averages. We mark these breakouts with red circles and subsequently with yellow areas that help us determine whether the breakout may be valid or not.
It is important to observe whether the price continues consolidating in these areas. If it eventually breaks upward, this is a positive signal that may indicate a continuation of the rise. On the other hand, rejections in these areas could indicate a possible price reversal.
Signals indicates a potential start of the Bullrun
Currently, we have observed how Signals is providing recovery signals and a potential start of a bullrun. The 30, 60, and 90-period moving averages have shown significant crossovers supporting this hypothesis.
30-period moving average in Signals Index
60-period moving average in Signals Index
90-period moving average in Signals Index
Importance of the time between breakouts
An important aspect of our analysis is the timing of the moving average breakouts. To consider these breakouts as valid, we have analyzed historical data and determined that there should be a maximum of 30 days between the breakout of the 30-period and 90-period moving averages.
In the current scenario, the difference has been 26 days, which reinforces the validity of the signal and increases the likelihood that we are witnessing a significant trend change.
Don’t miss Bitcoin’s next move. With Signals, you have the opportunity to anticipate major market movements and maximize your returns. Get a basic license on our platform with a 40% discount using the code ESTUDIOPRO40 until November 4 and access this powerful tool.
CONCLUSION
The analysis conducted with Signals suggests that we might be at the beginning of a bullrun in the Bitcoin market. Breakouts in the 30, 60, and 90-period moving averages provide us with a solid perspective on the market’s potential direction.
The price consolidation in the identified areas and its subsequent breakout to the upside are positive indicators that support this hypothesis. Additionally, the fact that the moving average breakouts occurred within a shorter time frame than the established maximum (26 days instead of 30) increases confidence in these signals.
Our perspectives are as follows:
Finally, it is important to use advanced analysis tools, such as on-chain metrics, to stay on the right side of the market at all times. With the right knowledge, we have already proven that it is possible to identify opportunities and make better decisions to achieve higher returns.
If you would like to learn more about Bitcoin’s upcoming movements and how we are analyzing them, don’t miss our advanced course. Every two weeks, we hold live sessions with students to study the market and analyze the strategies presented in our training, using all available data. Now, by purchasing the advanced course, you’ll receive the basic course as a bonus, so don’t hesitate to start now to stay ahead of Bitcoin’s upcoming price movements. Additionally, you can join our Discord, where you’ll be able to interact with our team.
Disclaimer of Liability This article does not offer any investment advice. All data is provided for informational purposes only. No investment decision shall be based on the information provided herein and you are solely responsible for your own investment decisions.
