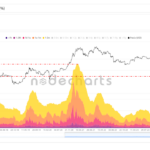
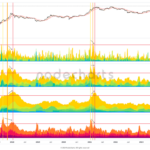
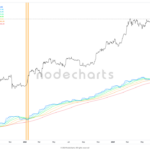
Two metrics that help us understand the behavior of network users are the average age of spent outputs and the median age of spent outputs. These metrics indicate the average and median days between the acquisition and sale of bitcoins, allowing us to observe whether those selling have recently entered the market or, on the contrary, have been in it for some time.
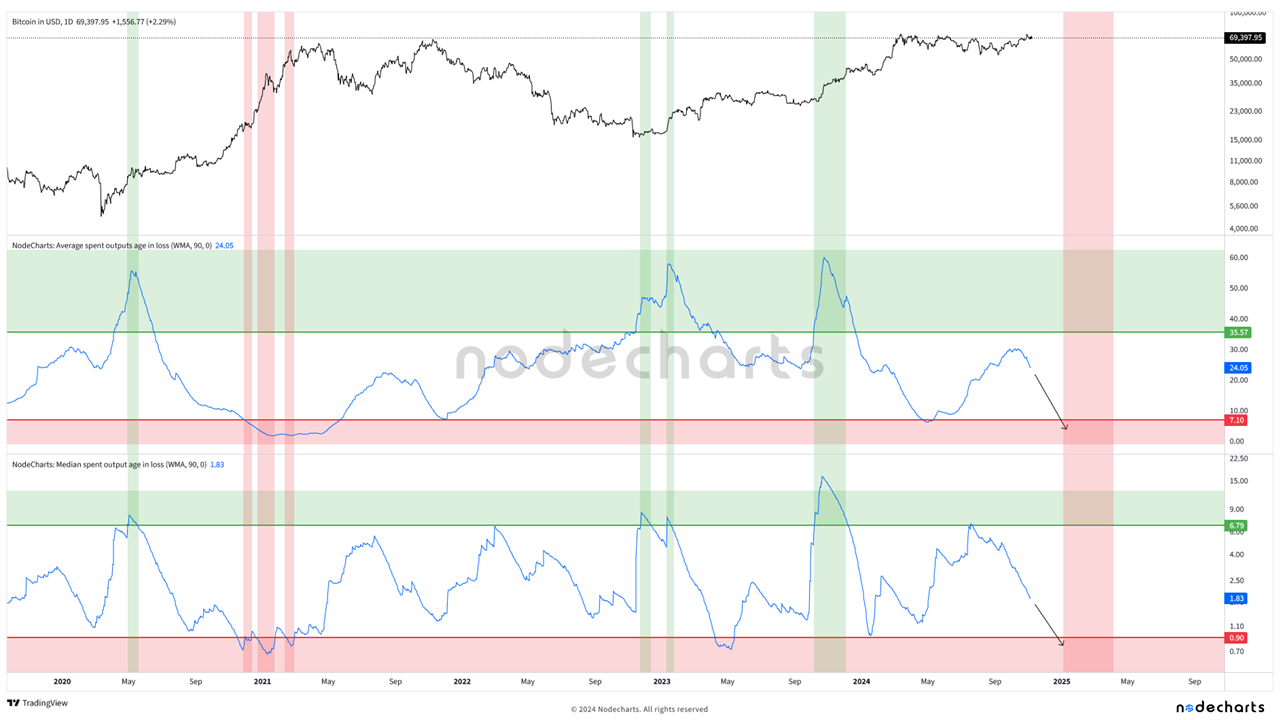
In the following chart, we will focus only on the cohort of users in losses. We have marked areas that indicate buying opportunities in green and potential selling zones in red. How did we create these areas?
To identify optimal buying moments, we look for high values in both the average and median of spent outputs. This tells us that users selling bitcoins are not only doing so at a loss but have also held those bitcoins for a significant time. We have determined that a confluence of values above 35 days in the average and 6.8 in the median has historically been a good indicator of Bitcoin accumulation.
As for favorable selling moments, these are detected when bitcoin sales in losses approach zero—that is, only those who recently acquired their bitcoins are selling at a loss. This is especially relevant in bullruns or end-of-cycle periods, as very few users are in losses during these times. We have observed that a confluence of values below 7 days in the average and 0.9 in the median has historically been an effective signal to sell Bitcoin.
Currently, we are waiting for both metrics to reach low values in days once again, which will allow us to identify the selling zone in this cycle. In the chart, we have represented this zone in red, along with the expected movement of the metrics using arrows.
