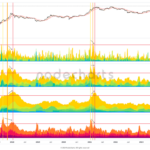
Thanks to the insights provided by on-chain analysis, we are able to study cyclical patterns that repeat time and time again during the same phases of an upward trend.
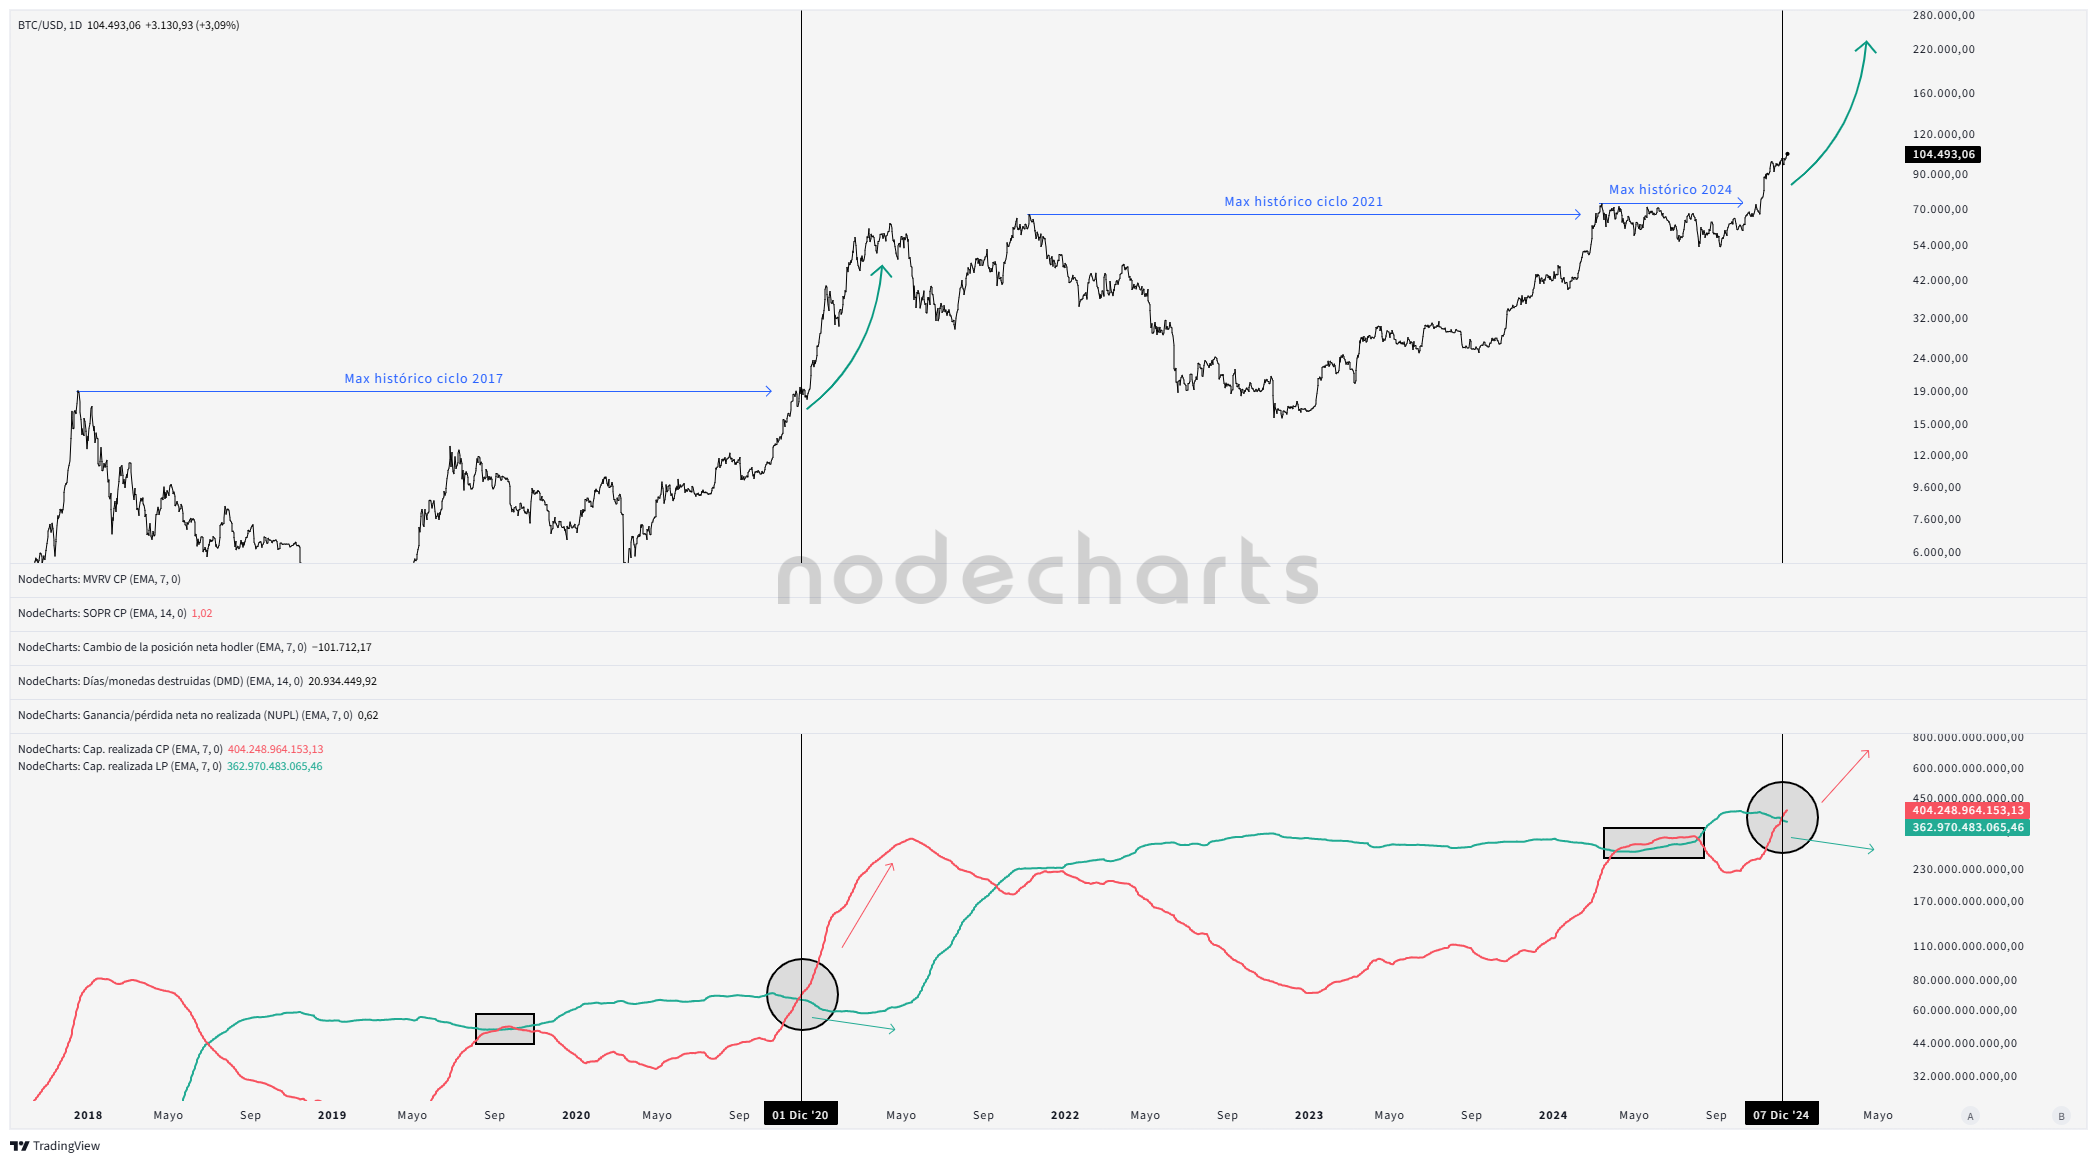
The current situation is no different from what we experienced in 2017 or 2021. Today, we propose a very simple exercise: analyzing the monetary mass invested by two main market participants—short-term and long-term investors.
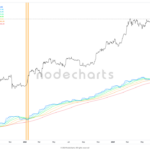
Long-term investors have been holding for several months or years, and now we need to monitor a decline in their realized capitalization, which would indicate a reduction in their positions relative to the more speculative cohort of the market, or short-term investors.
The latter, the new investors entering the market now, are generally those who enter late, driven by negative emotions such as FOMO, or in many cases, a lack of knowledge. We can assert this because we not only study their behavior but also the phase of the cycle in which they make their moves.
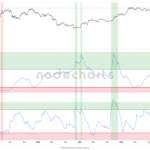
As I mentioned earlier, one of the most reliable cyclical patterns is the entry of capital from short-term investors (ST) at the expense of the profit-taking, distribution, and selling by long-term investors (LT). In this image, we can see that we are in that phase of the cycle where ST investors surpass LT investors as the price progresses.
This leads us to ask a question… Are we at the beginning of a Bull Run? The answer is obvious: yes. However, we must also closely monitor other key metrics to create reliable perspectives and an optimal distribution strategy.
