In recent weeks, this question has been asked far too many times, and the reality is that no one knows the “when.” What we on-chain analysts do know is the “how.” So, let’s reframe this question.
When will the market top be reached?
Now that we’ve asked the right question, we must understand that there are countless metrics that can be used together to define efficient distribution or stepwise selling strategies for our portfolio as a cycle peak approaches.
Today, we’ll explore one of these logical market responses, which will indicate whether the market is overvalued and, most importantly, with high probability, where the market top of this cycle will be located.
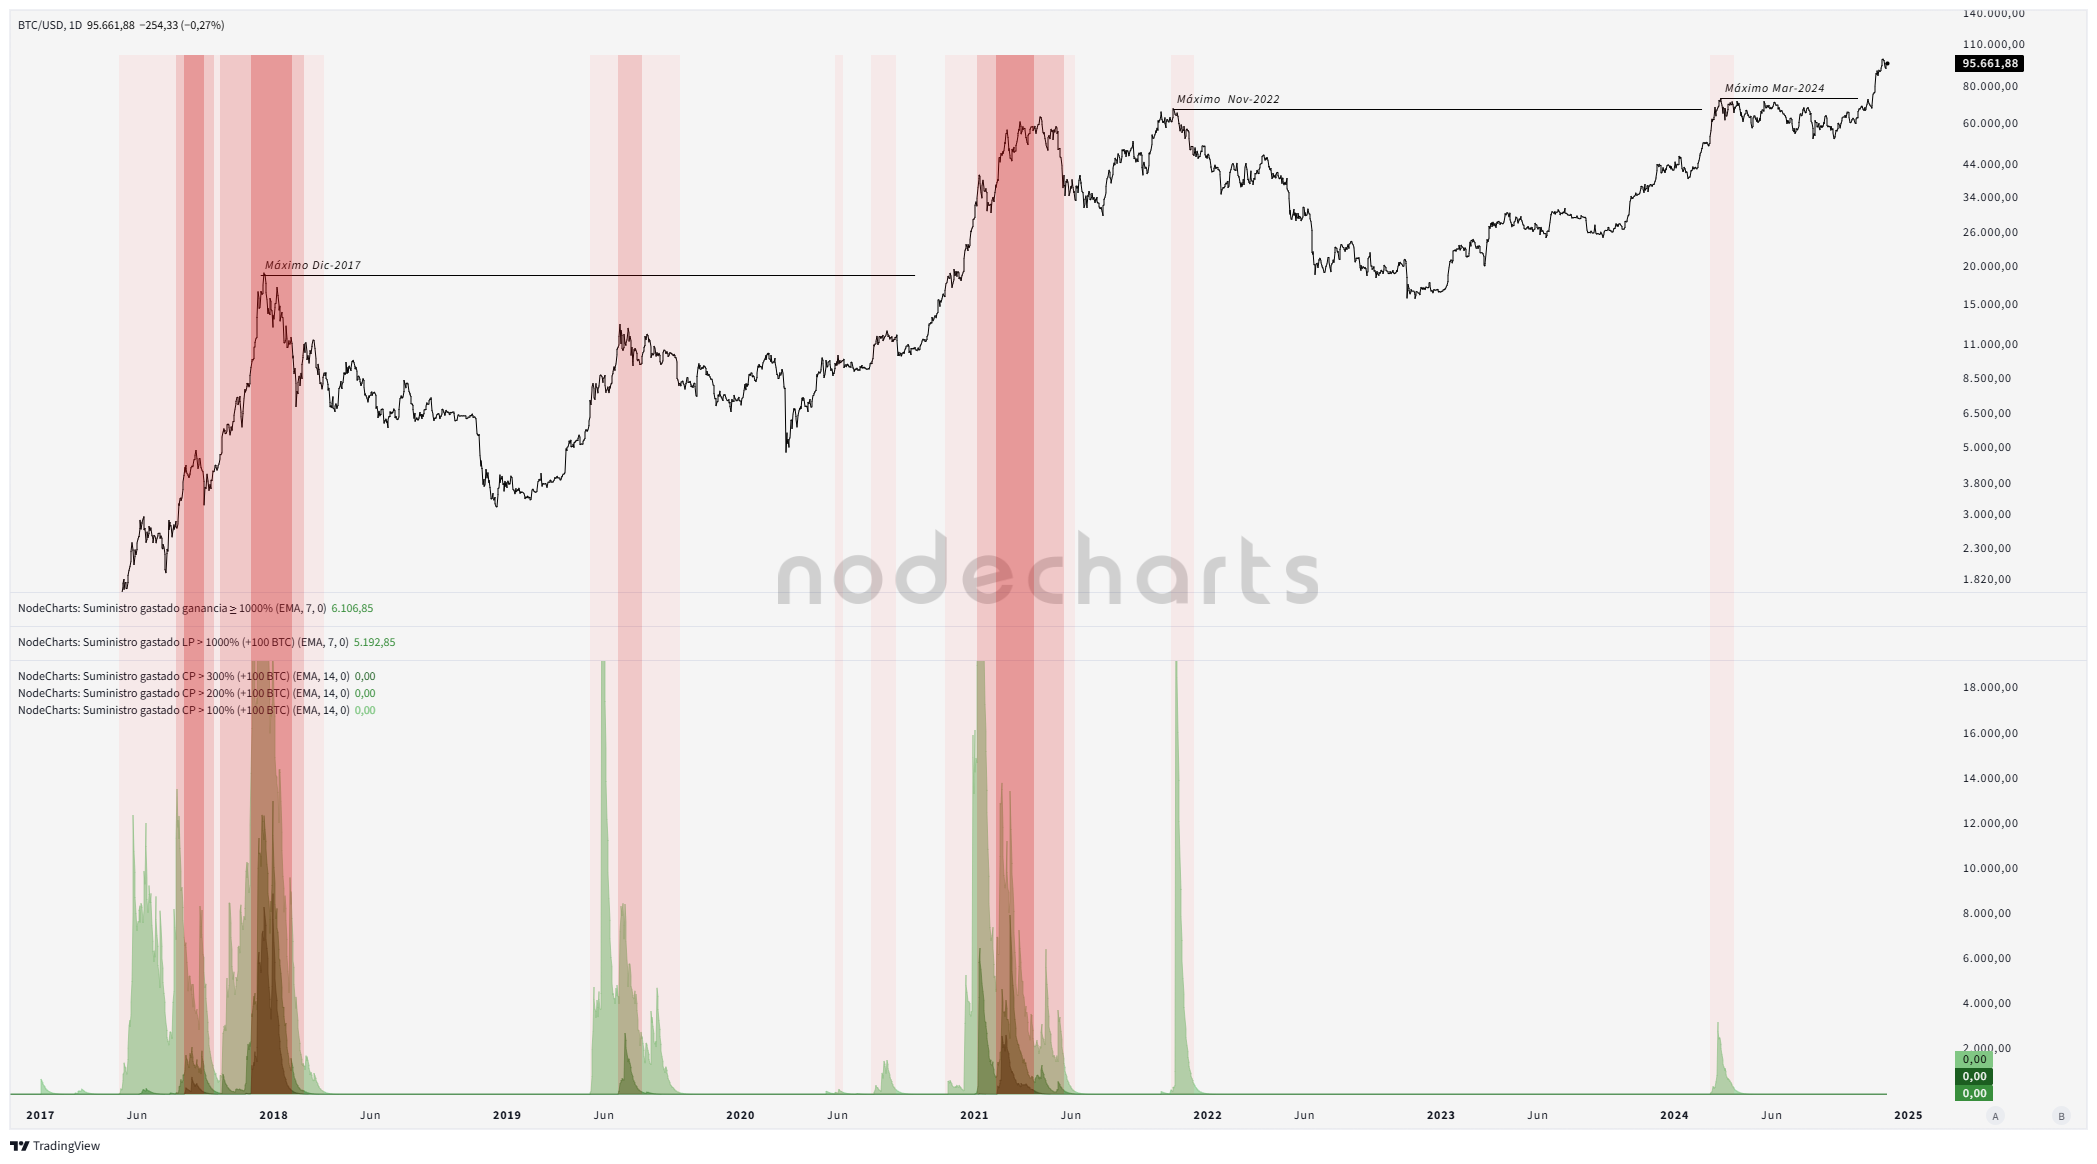
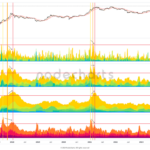
Let’s use a highly useful metric, one that defines the spending behavior of short-term investors with large returns, but who hold over 100 Bitcoins. These are well-informed investors, knowledgeable about the market—whales and large traders who influence the final stages of a bull cycle due to their profit-taking.
By applying a simple weighting system, from +100% returns to +300%, and marking these with increasingly vibrant colors, as shown in the image, we create a simple and efficient indicator that logically defines cycle tops.
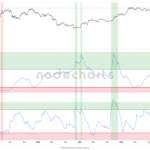
But that’s not the most important part. The real value lies in the stepwise signaling system we obtain. This model helps us gradually reduce our portfolio or, at the very least, measure and quantify the euphoria of a bull run.
These readings are the day-to-day conclusions for BTC hodlers with on-chain analysis knowledge. They provide objectivity and, most importantly, calmness when building or reducing your crypto portfolio.
