ABSTRACT
Welcome to the first Nodecharts research report.
In this first edition, we will take an in-depth look at one of the most interesting on-chain metrics in existence, as it recently reached values not seen since 2020. We are talking about the Spent Output Profit Ratio (SOPR) indicator, translated into Spanish as Ratio de Ganancias de Salidas Gastadas.
Created in 2019 by Renato Shirakashi, the SOPR is a metric that tells us the aggregate gains and losses realized in a particular block or day. It is calculated from the outflows spent of all bitcoins in a given block or over a given period of time (hours, days, etc.) and provides information on market sentiment.
To obtain this indicator, the realized dollar value is divided by the dollar creation value of the outflows. In simple terms, the SOPR is the selling price divided by the acquisition price of bitcoins spent.
Let’s take a look at the SOPR formula:
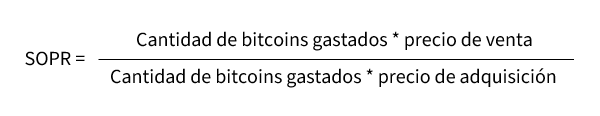
• When the SOPR is greater than 1, the set of bitcoins spent during the time period is sold at a profit.
• When the SOPR is less than 1, the set of bitcoins spent during the time period is sold at a loss.
• When the SOPR is equal to 1, the set of bitcoins spent during the time period is sold at the same price they were acquired.
Let’s take a more concrete example to see what this is all about. To do this, we will use the formula and the result with respect to the quantities in our example.
Let’s imagine a user who acquired 50 bitcoins in 2015 at a price of $300 and in 2016 sold his bitcoins at a price of $500.
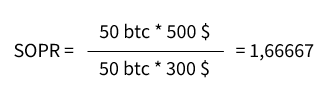
In this case, the SOPR value of the transaction would be 1.6667. This indicates that the profits obtained by this user are 66.67% relative to the initial investment (1.6667 – 1 * 100).
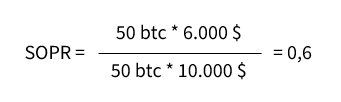
Contrarily, a user who acquired 50 bitcoins in 2018 at a price of $10,000 and in 2019 sold his bitcoins at a price of $6,000 made a 40% loss on the initial investment (1- 0.6 *100).
Now that we are clear on how it is calculated and the meaning of the SOPR, we will analyze the charts of this metric. To do so, we will apply different types of moving averages and we will look at variants such as the adjusted SOPR and the short and long term SOPR. In this way, we will be able to detect tops and bottoms of the last cycles, trends and moments of accumulation and distribution.
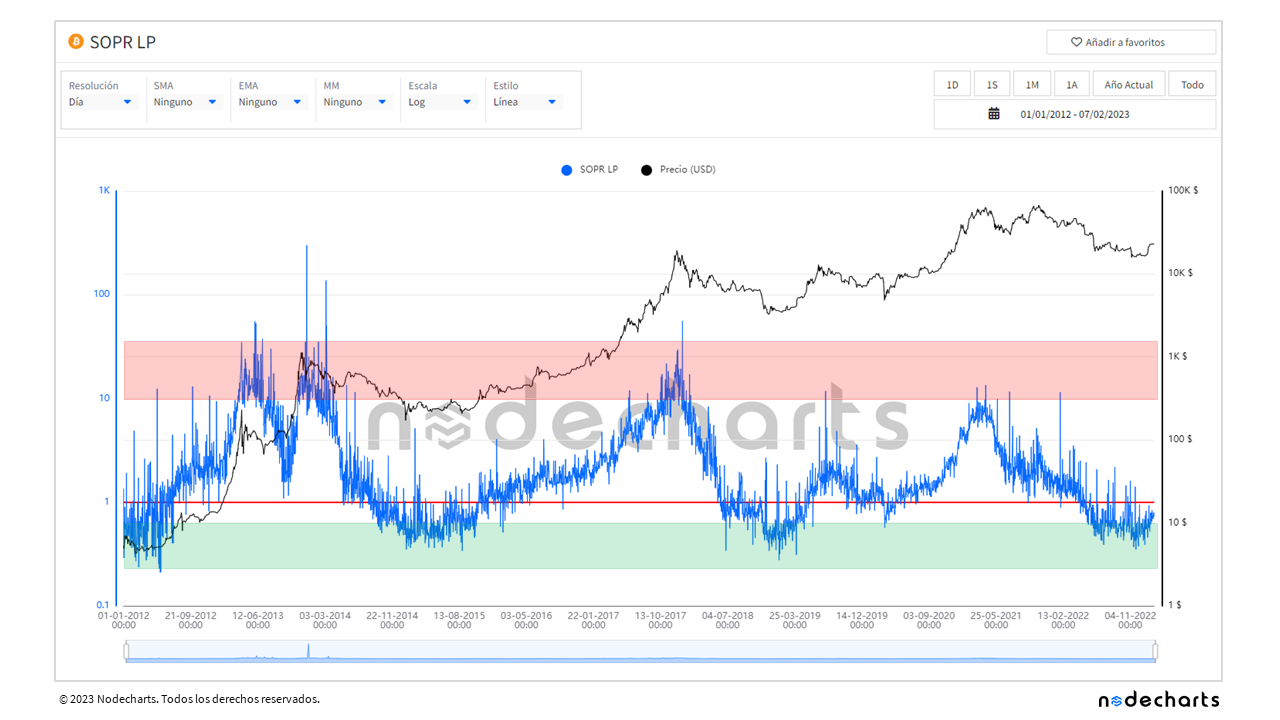
SOPR
• Key values in bull market (10-year history): ≥1.08
• Key values in bear market (10-year historical): ≤0.92
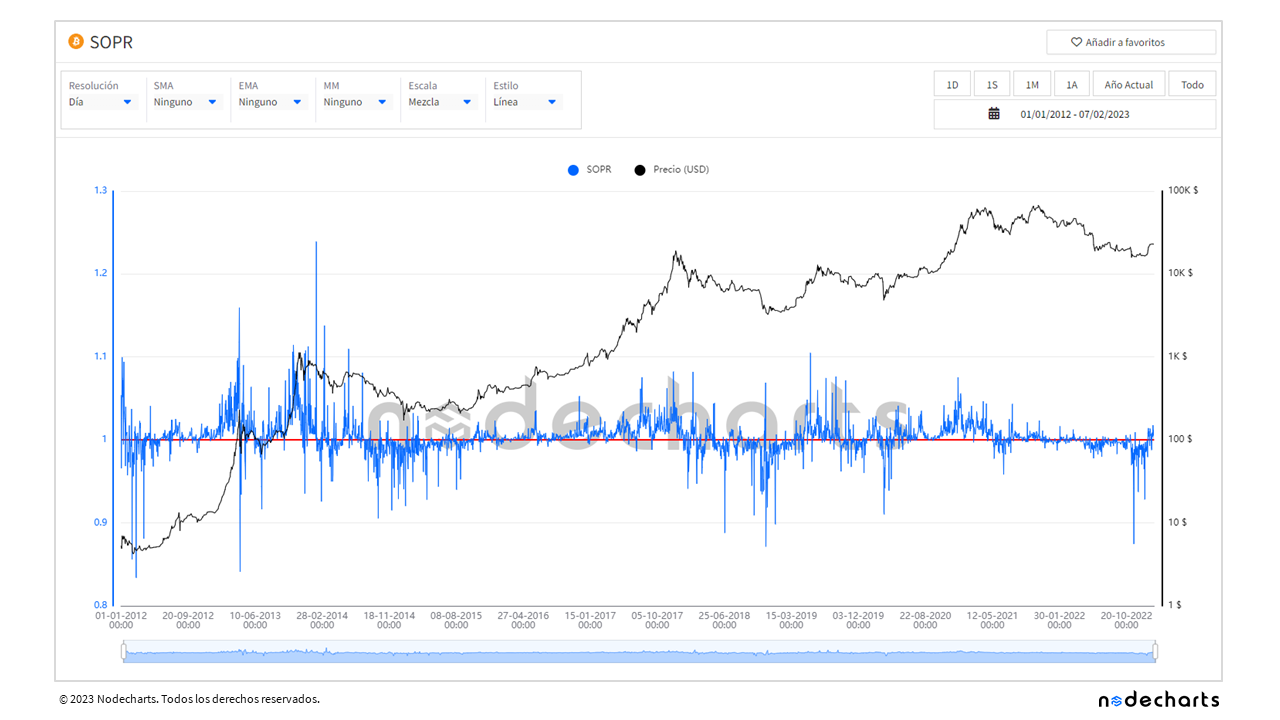
This is the SOPR chart. At a glance, you can see that, in bull markets, the SOPR tends to stay above 1 and, conversely, in bear markets, the tendency is to stay below 1.
One of the problems of using the SOPR is that it contains too much noise. To reduce this noise it is convenient to apply moving averages in order to identify, confirm trends more easily and smooth the fluctuations of the metric. In this way, we will get a clearer picture of the overall sentiment of Bitcoin holders and the direction of the market.
One of our favorite averages for detecting when the market gains or loses strength during a trend is the 14-period exponential average.
SOPR (EMA14)
• Benefits: Smooth fluctuations in the metric
• Key values in bull market (10-year historical): ≥1.03
• Key values in bear market (10 year historical): ≤0.98
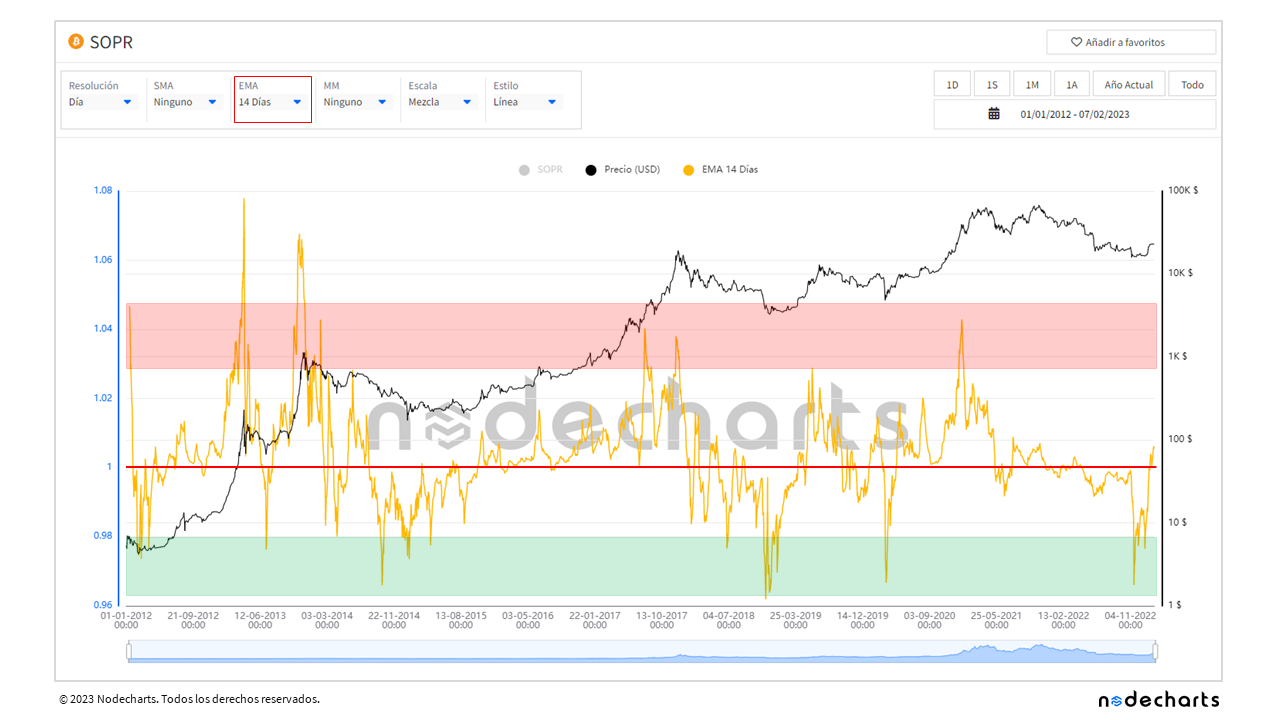
As we can see in the image, values above 1.03 are zones where the market as a whole is overbought or taking profits. In areas below 0.98, the market is either oversold or taking losses. From a historical perspective of over 10 years, these values have been the points that have marked the ends of bull and bear markets.
Let us now look at how to use the indicator to follow trends.
Bullish trend
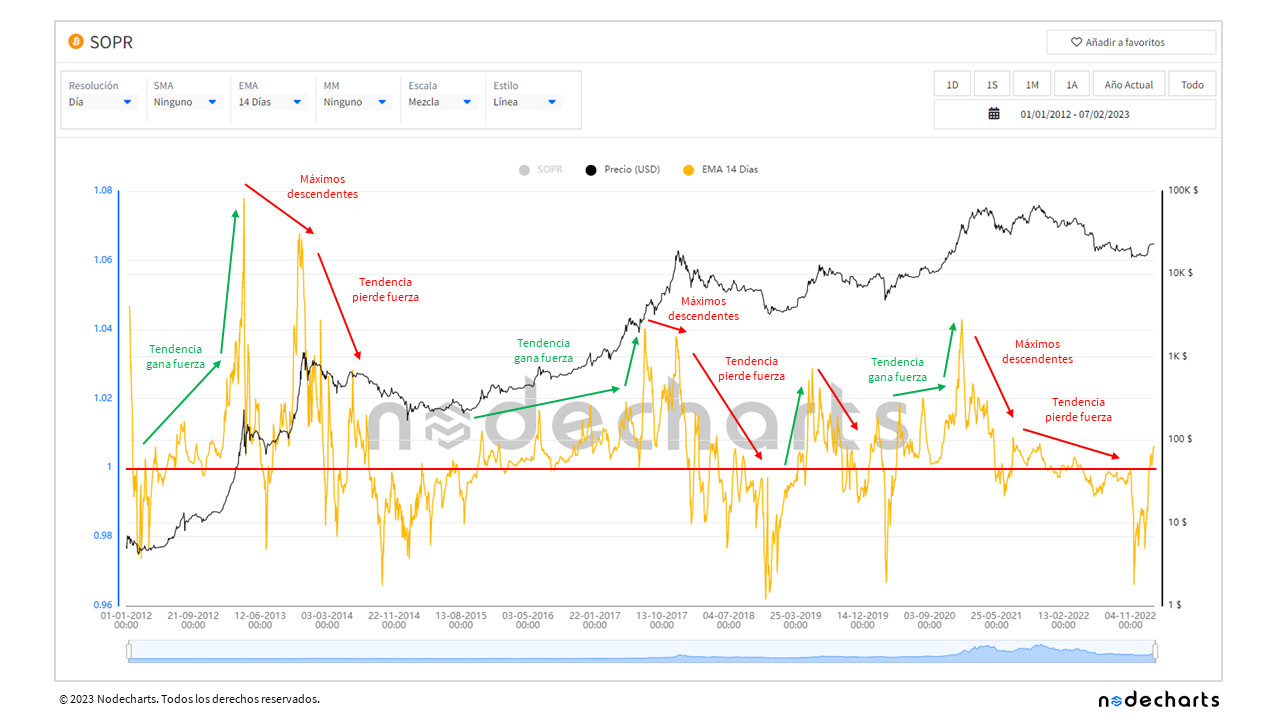
If the SOPR trends bullish over a period of time and makes new highs on each move, it indicates that the bullish trend is healthy and the market is likely to continue rising (green lines). Conversely, if falling highs are made in an bullish trend, it indicates that profitability is declining and will be a sign of weakening and, potentially, a signal of a shift from a bull market to a bear market (red lines).
Bearish trend
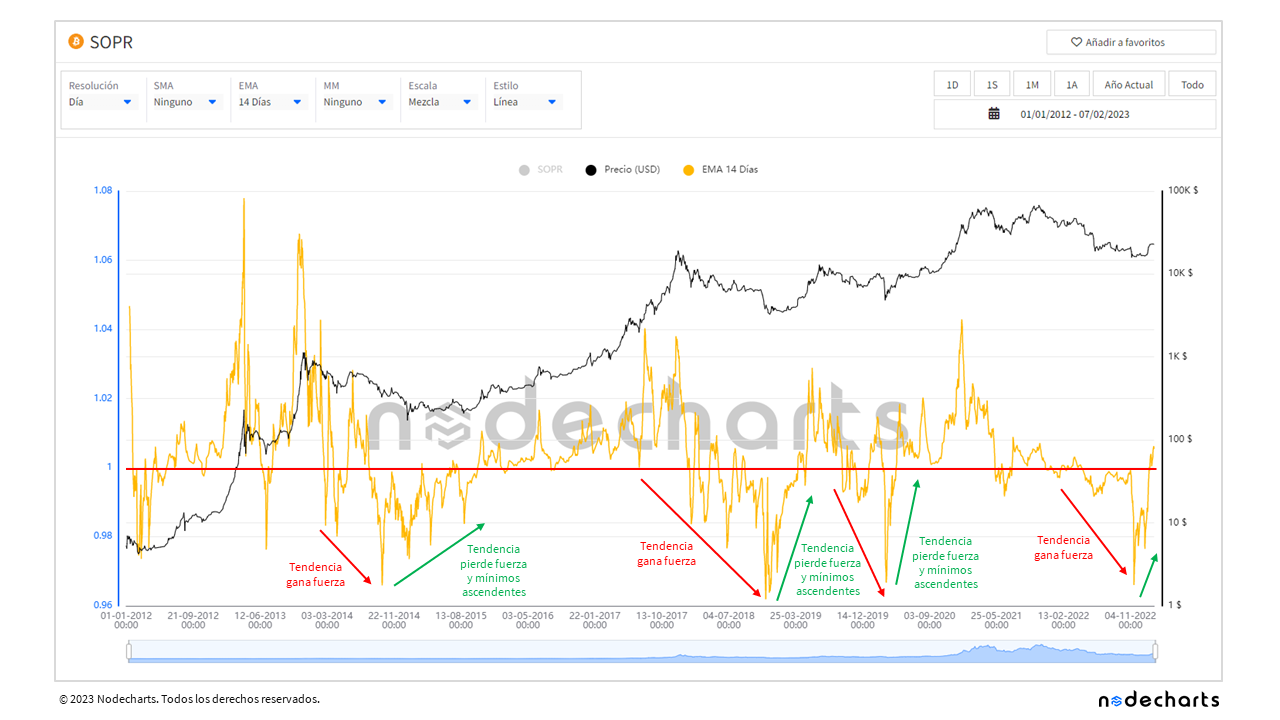
If the SOPR is in a bearish trend, making new lows on each move, it indicates that the bearish trend is healthy and the market is likely to continue falling (red lines). Conversely, if rising lows are made in a bearish trend, it indicates that losses are diminishing and will be a sign of weakening and potentially a signal of a shift from a bear market to a bull market (green lines).
Current reading
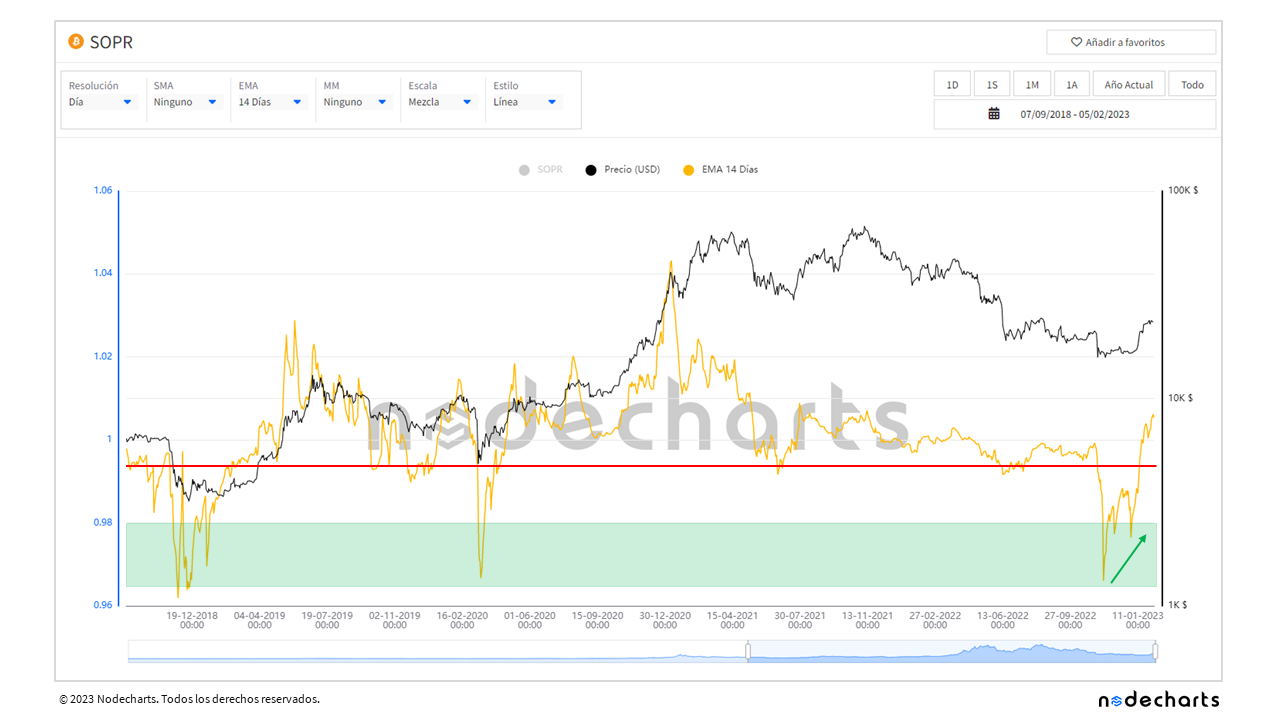
In November 2022, the SOPR marked the lowest point since 2020, and on December 31, it was back below 0.98 again. In the last 10 years, it has only been at these levels four times, which have marked the lows of corrections.
In addition, we can see that a bullish divergence is forming through rising lows. If the SOPR stays above 1, it would indicate that bitcoin holders are confident that the price can continue to rise. If the SOPR falls back below 1, it will be important that it continues to form these rising lows in order to continue to see a price recovery.
There are different variants of the SOPR when we apply time filters in the formula between the time of purchase and the time of sale. Today we are going to look at three of these variants.
ADJUSTED SOPR
• Calculation method: The adjusted SOPR consists of performing the same calculation (sale price / acquisition price), but omitting all transactions, which between the time of acquisition and sale are less than one hour
• Benefits: Reduce potential noise in the market, as transactions less than one hour usually do not result in large profits or losses, however, they have an impact on the overall profit and loss
• Key values in bull market (10-year historical): ≥1.25
• Key values in bear market (10-year historical): ≤0.85
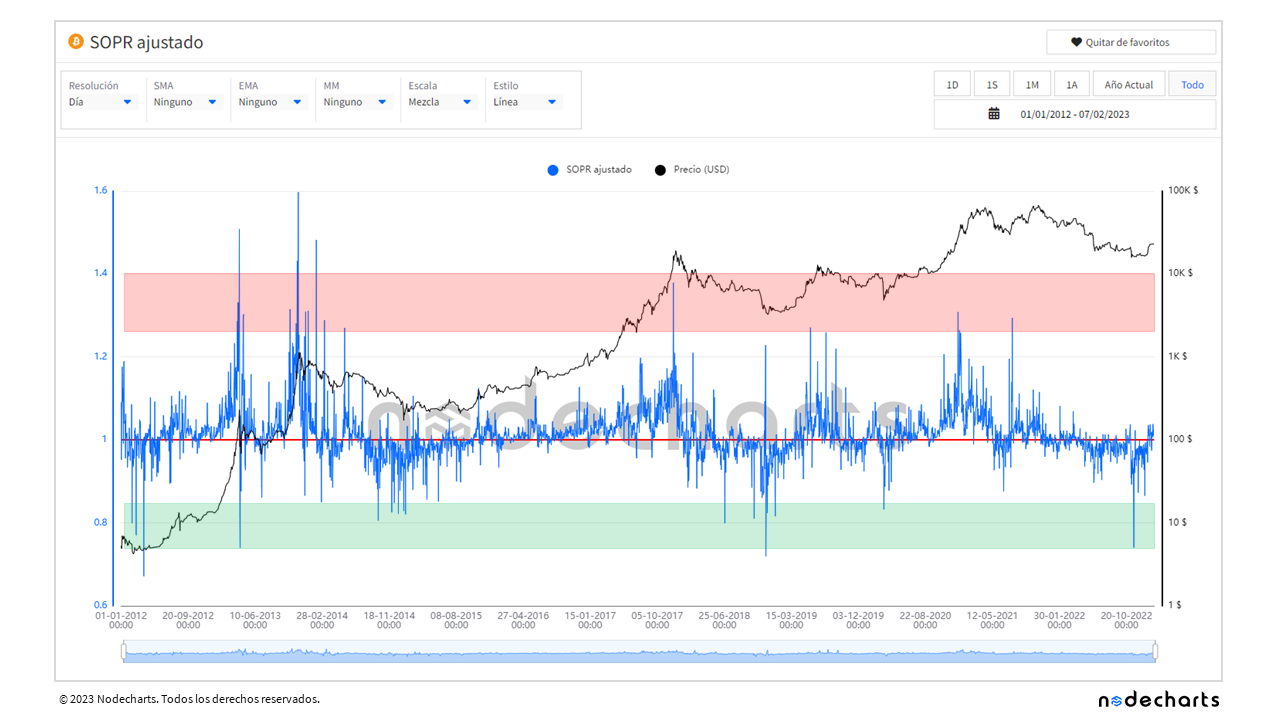
With this variant, we observe that the points that have marked the ends of bull and bear markets are much clearer, without having to apply any moving average.
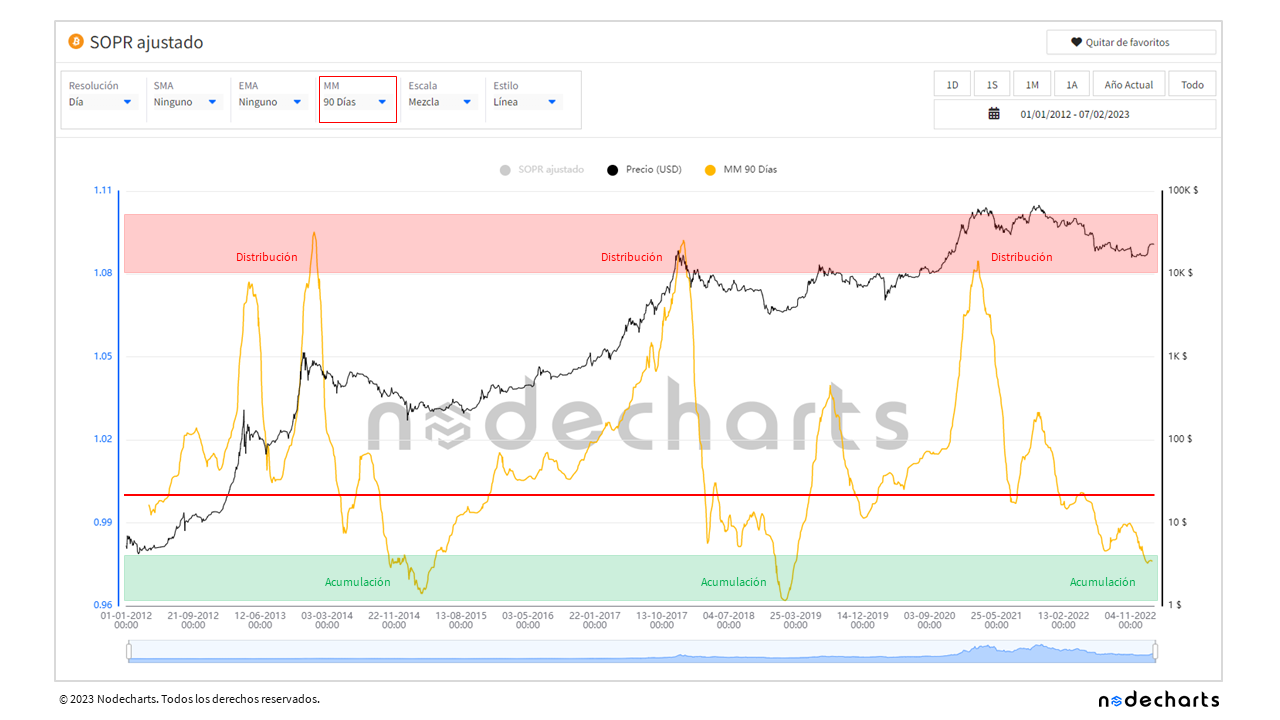
Although to look for accumulation and distribution processes, from Nodecharts we apply a 90-day moving average that allows us to find the low and high points of the market.
ADJUSTED SOPR (MM90)
• Method of calculation: Apply a ninety-day moving median to the adjusted SOPR
• Benefits: Identify and confirm the market trend more easily In addition, the accumulation and distribution processes of bitcoin cycles are visible
• Key values in bull market (10-year history): ≥1.08
• Key values in bear market (10 year historical): ≤0.98
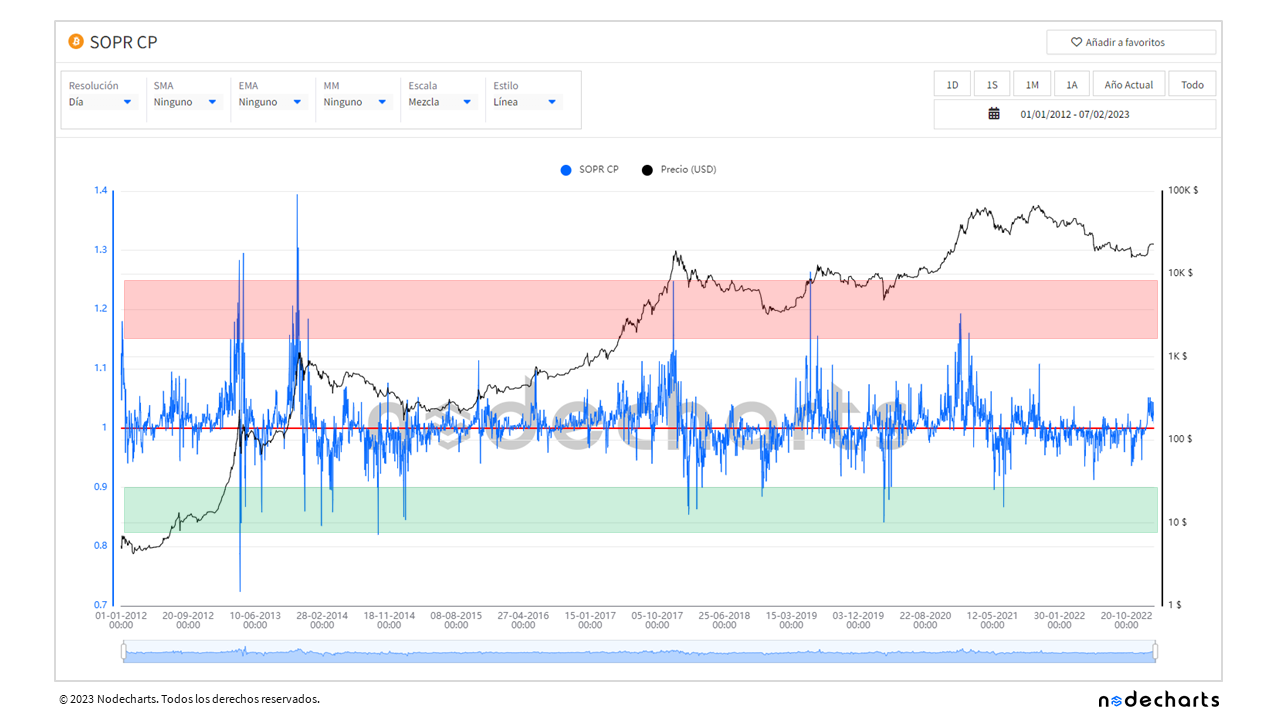
SHORT-TERM SOPR
• Calculation method: The short term SOPR consists of performing the same calculation (sale price / acquisition price), but omitting all transactions, which between the time of acquisition and sale are less than one hour and all those that are greater than 155 days
• Benefits: Identify the behavior of market speculators
• Key values in bull market (10-year historical): ≥1.15
• Key values in bear market (10 year historical): ≤0.98
LONG-TERM SOPR
• Calculation method: The long-term SOPR consists of performing the same calculation (sale price / acquisition price), but omitting all transactions, which between the time of acquisition and sale are greater than 155 days
• Benefits: To identify the behavior of market hodlers In addition, the accumulation and distribution processes of bitcoin cycles are more visible
• Key values in bull market (historical 10 years): ≥10
• Key values in bear market (10-year historical): ≤0.5
It should be noted that the SOPR is only one metric and should be considered along with other indicators and data to get a complete picture of the market. Also, all values have performed over the last 10 years, but could change over the next 10 years.
Anyway, from Nodecharts, we will follow these and many more indicators, making reports for the community in order to observe if these levels change over time.
Disclaimer: This article does not provide any investment advice. All data is provided for informational purposes only. No investment decision shall be based on the information provided herein and you are solely responsible for your own investment decisions.