Nodecharts #034 – On-chain data predicted this bull run
ABSTRACT Welcome to a new report from Nodecharts! Since our last report, we have observed Bitcoin’s price rise from $70,000 to $90,000. In that report, we mentioned the strategy based on the Signals moving average crossover, which indicated that we were on the brink of a bull run. If you missed it, you can review […]
Nodecharts #033 – Good Signals for Bitcoin
ABSTRACT Welcome to a new report from Nodecharts! In recent days, we have witnessed a remarkable surge in Bitcoin’s price, reaching levels nearly equal to its all-time high. This bullish movement has generated enthusiasm in the market and reignited the interest of investors and analysts. An important factor we attribute to the price increase, as […]
Nodecharts #032 – Bitcoin’s key support levels
ABSTRACT Welcome to a new report from Nodecharts! The recent military conflict between Israel and Iran has sparked a new wave of uncertainty in global markets, significantly impacting the cryptocurrency ecosystem. Geopolitical tensions have caused Bitcoin’s price to retreat once again to the $60,000 zone, a level that is not only significant from a technical […]
Nodecharts #031 – Bitcoin in its decisive phase
ABSTRACT Welcome to a new report from Nodecharts! This week, we had a key event on the horizon, and the FOMC has finally decided to lower interest rates by half a point, bringing them to 5%. Although many anticipated this half-point reduction, the decision has triggered an initially positive reaction, suggesting that part of this […]
Nodecharts #002 – Profits, losses and profitability
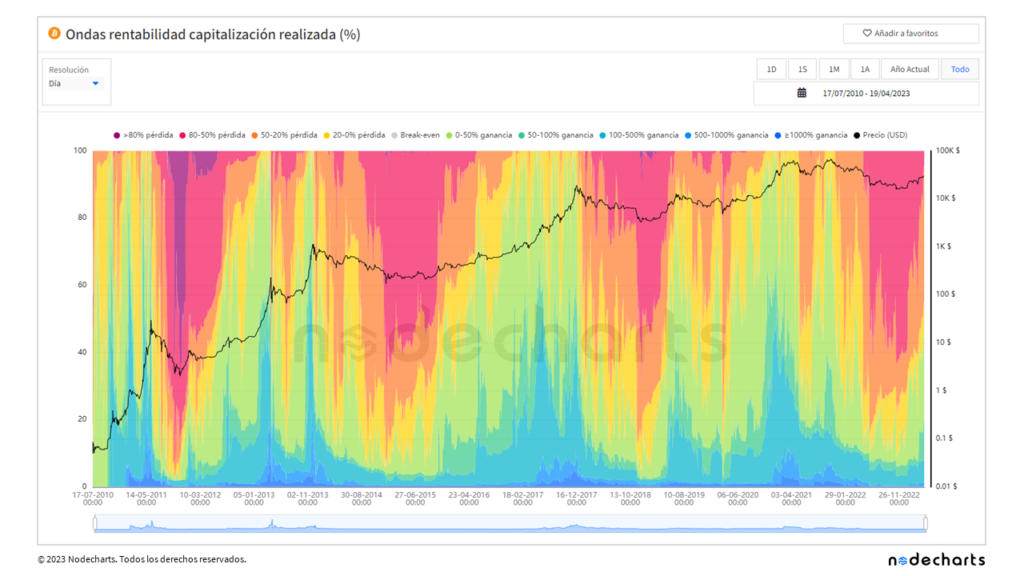
ABSTRACT Welcome to the second Nodecharts research report. This time, we would like to talk about profits, losses and profitability and introduce you to some metrics that we have recently added to our studio, which provide us with extraordinary information to find market bottoms and tops. Before we dive into this analysis and put it […]
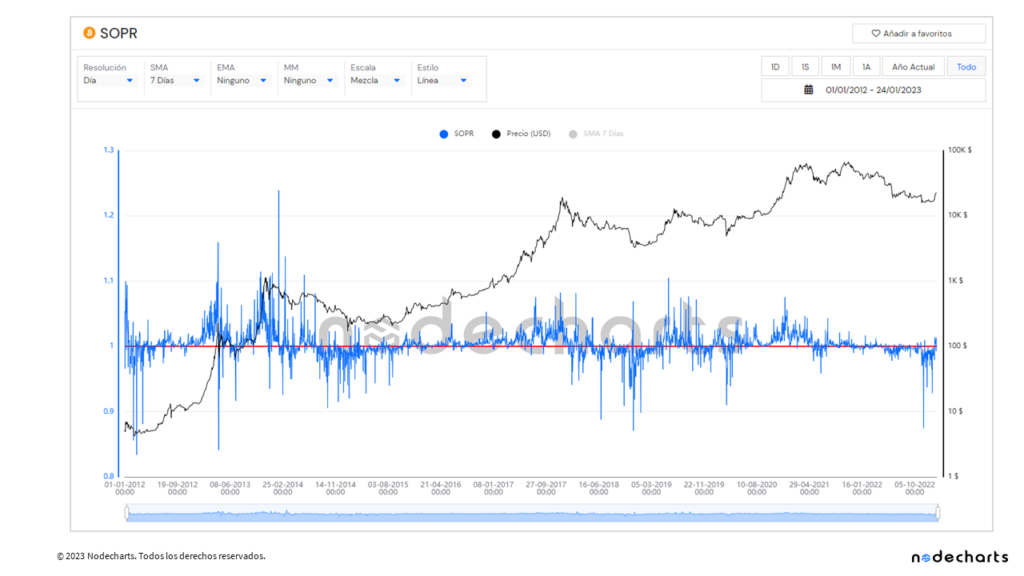
Nodecharts #001 – SOPR in depth
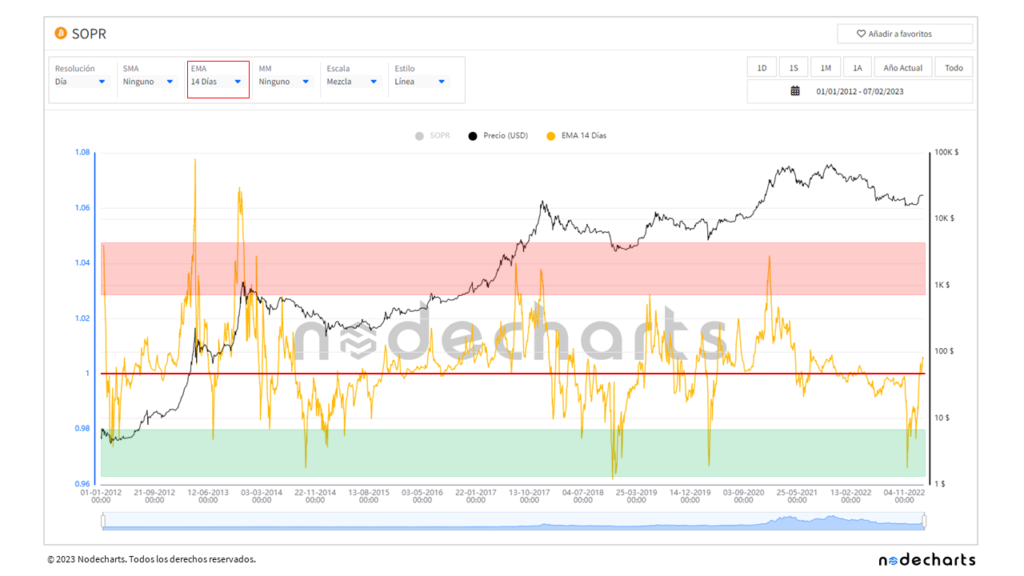
ABSTRACT Welcome to the first Nodecharts research report. In this first edition, we will take an in-depth look at one of the most interesting on-chain metrics in existence, as it recently reached values not seen since 2020. We are talking about the Spent Output Profit Ratio (SOPR) indicator, translated into Spanish as Ratio de Ganancias […]
Nodecharts: Real time crypto intelligence
This week we present the new Nodecharts platform specifically designed to simplify data analysis for investors, traders and institutions interested in the crypto market. Nodecharts is a market intelligence tool with an user-friendly experience that provides users with a wide range of data, tools and historical statistics on the Bitcoin blockchain. Everything you need to […]